

A fellow health wonk solves the TX/KY enrollment mystery...and it makes perfect sense
Sat, 12/19/2020 - 11:55am
In my Twitter thread yesterday breaking out the semi-final HC.gov weekly snapshot enrollment report, I noted:
STATE LEVEL:
--25 out of 36 states outperformed last year
--Best % increase y/y: TEXAS (+14.9%)
--Worst $ decrease y/y: KENTUCKY (-6.7%)I have no idea if there's anything special in either state which caused either to do as well/poorly as they did relative to last year.
My colleagues Colin Baillio and Andrew Sprung took note of this, and Sprung decided to look into it further. He broke out the states between Medicaid expansion and non-expansion states, and voila:
From the state totals one obvious pattern leaps out: enrollment is up 9.7% in states that have not enacted the ACA Medicaid expansion -- and down 0.5% in states that have expanded the expansion (including Nebraska, which opened the Medicaid expansion doors in October of this year).
The Affordable Care Act expands Medicaid elibility to those earning up to 138% of the Federal Poverty Level (in 2021, that's $17,608/year for a one-person household or $36,156/year for a family of four)...but only in states which have expanded the program under the ACA.
For those earning 100 - 400% FPL, the ACA offers financial assistance for those enrolling in exchange plans...but because of the income overlap (100 - 138% FPL), this depends on whether you live in an expansion or non-expansion state:
- Expansion States: Medicaid up to 138% FPL, Subsidies from 138 - 400% FPL
- Non-Expansion States: NOTHING up to 100% FPL, Subsidies from 100 - 400% FPL
In every state, of course, if you earn more than 400% FPL you receive no assistance whatsoever...the dreaded Subsidy Cliff.
Every year, some people shift up or down the income scale for one reason or another, and transition between being eligibile for Subsidies, Medicaid or Nothing At All depending on where they live...but in 2020 (and leading into 2021), this "churn" has been pushed into overdrive by the massive loss of employment and income across every state due to the COVID-19 pandemic.
Sprung goes into more detail about all of the variables this year, including things like the supplemental unemployment insurance and one-time relief checks sent out last summer which caused people's incomes (and eligibility) to jump around a lot.
Since his post only looks at states hosted via HealthCare.Gov, I've recreated the tables to include the state-based exchanges (SBEs) as well. Nothing changes on the Non-Expansion State table because all of those states are hosted via HC.gov anyway (not surprising...states which refuse to expand Medicaid also tend not to want to run their own exchanges either...Idaho was the sole exception until this year, but then they went ahead and expanded Medicaid after all):
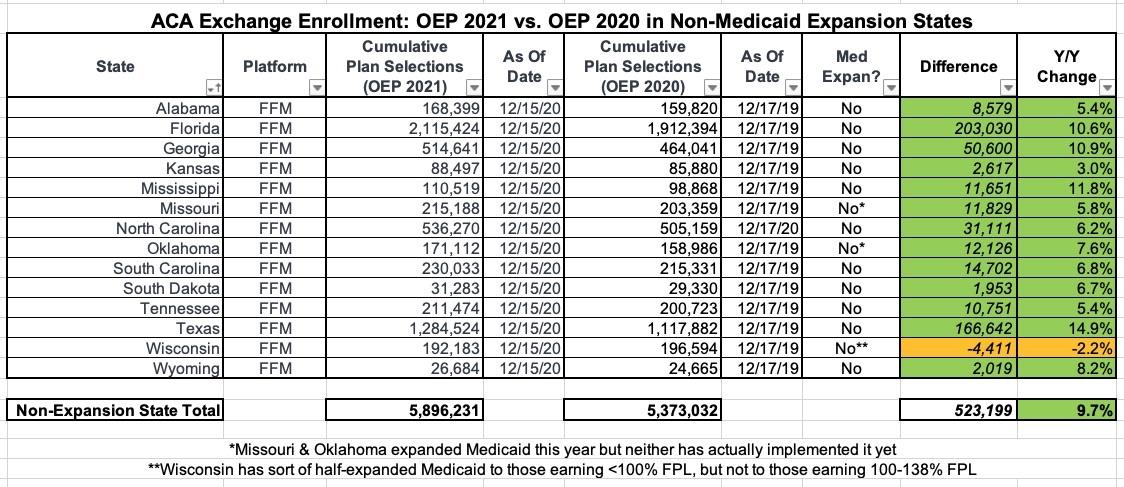
As Sprung notes, and as i mention above, even Wisconsin's slight drop makes sense given that they're sort of half expansion/half non-expansion.
The Expansion State table, however, is different...if only slightly so for now, because Maryland is the only SBE to a) have completed Open Enrollment and b) posted their final Open Enrollment numbers. Vermont ended theirs on 12/15 but hasn't posted any data, and the rest of the states all have later Open Enrollment deadlines anyway. Some of these have posted partial data, but it's unreasonable to compare those against last year's final numbers, though I've done so for completeness below (see the grey row in the second table).
With Maryland added, average Expansion State enrollment year over year goes from -0.5% to -0.2%, a slight improvement. The full picture won't be known until the other 14 SBM states release their final OEP data, of course.
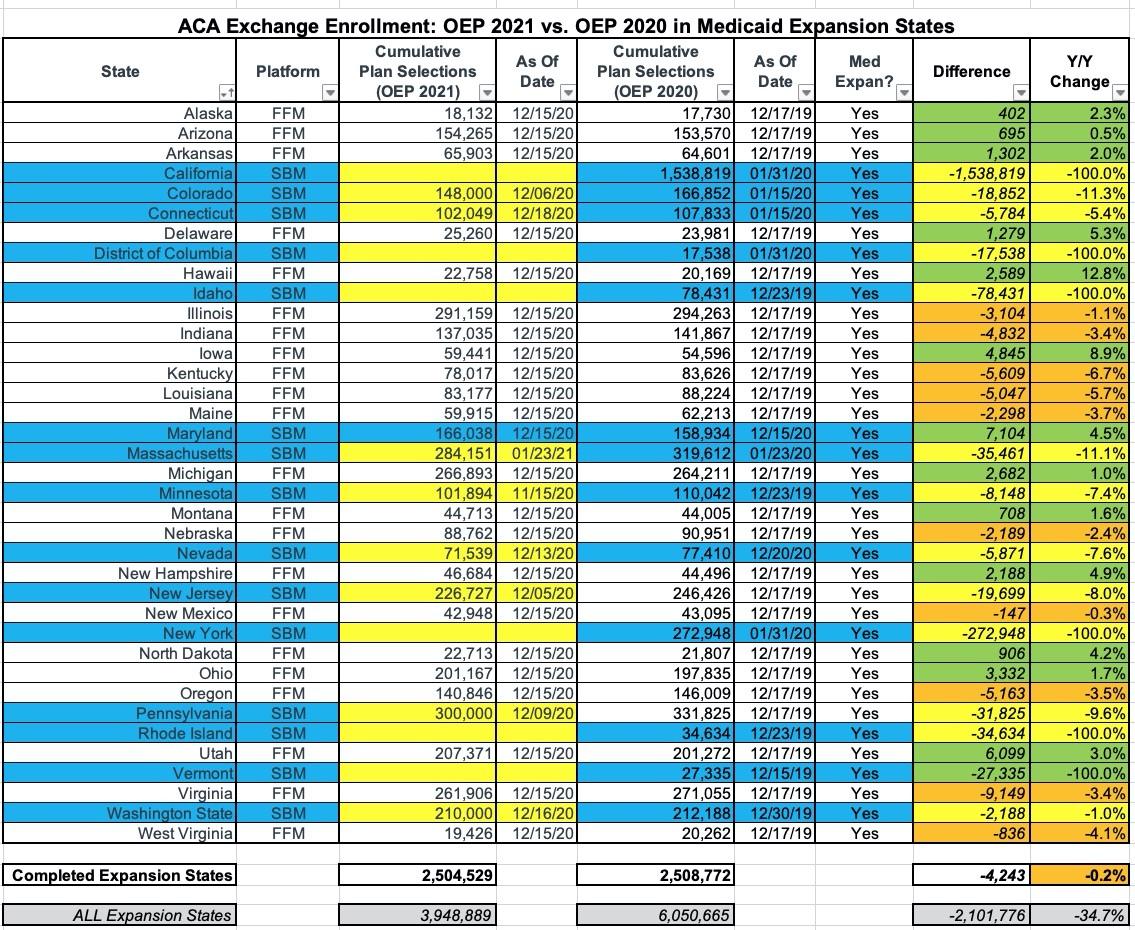
Again, that apparent "35% drop" in grey is meaningless since California, DC, Idaho, New York, Rhode Island and Vermont haven't provided any data yet, while the numbers from Colorado, Connecticut, Massachusetts, Minnesota, Nevada, New Jersey, Pennsylvania and Washington State are only partial.
In addition, it's important to note that even the HC.gov states will likely see their final numbers drop slightly in the final CMS report which will likely be released next week. Last year, for instance, the final report had HC.gov enrollment drop by around 14,000 people, mostly due to people being unable to provide documentation of their legal residency status, or due to people changing their minds and cancelling their enrollments at the last minute. It will likely be a smaller drop this year due in part to New Jersey and Pennsylvania splitting off onto their own exchanges, as well as the higher percentage of renewals by current enrollees; I'd be surprised if HC.gov's numbers drop by more than 10,000 or so.
Advertisement
