

YOU DOWN WITH SEP? YEAH, YOU KNOW ME!
NERD ALERT: More Fun with SEPs and Effectuated Enrollment!
Earlier this week I busted the Trump Administration's CMS division for releasing a misleading report which tried to understate the enrollment retention rate of ACA exchange enrollees. I'm not entirely sure why they did this, since even their "fudged" number wasn't really that much worse than previous years (they tried to make itt look like a March attrition rate of 15.4% vs. the 12.8% and 12.6% from 2015 and 2016 respectively), but for whatever reason, they did so. The short version is that they only included enrollees who paid for their January and February policies instead of also including those who paid their March premiums, as was done in previous years. As far as I can figure, the actual 3/31/17 effectuation rate closer to 11.8%, a slight improvement over 2015 and 2016, though I can't be certain about this without knowing how many of the ~500,000 people who signed up in the last 2 weeks of January paid and were effectuated for March coverage.
In any event, this led me to whip up a graph comparing the national monthly effectuation rate for all 4 years: 2014, 2015, 2016 and the first 2 months (not 3!) of 2017. CMS themselves provided hard numbers for all of 2016 in their same misleading report, and the Obama Administration CMS had done so previously for 7 months in 2014 and 2015; for the other months I had to use my best estimates based on the data I have on hand. Here's what it looks like:
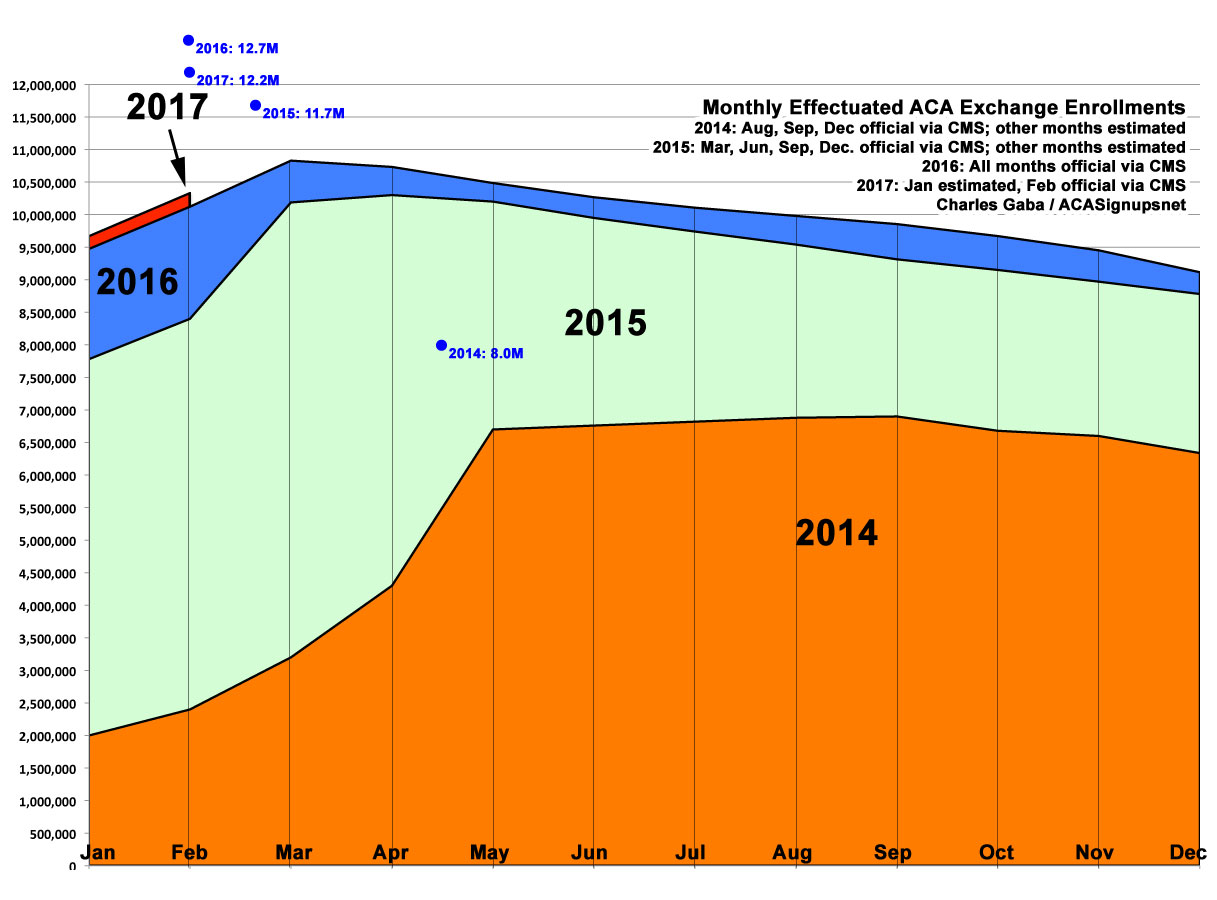
However, this raises another problem which has irritated me for awhile now: Knowing the actual number of people enrolled every month still doesn't tell you how many of them are the same people. If 10,000 people drop their coverage in May but another 8,000 sign up for an off-season policy (via a Special Enrollment Period) due to having a Qualifying Life Event (QLE), the "effectuated enrollment" number for May will only show a net 2,000 loss. If 100,000 drop out and 98,000 sign up...it'll still show a net 2,000 loss.
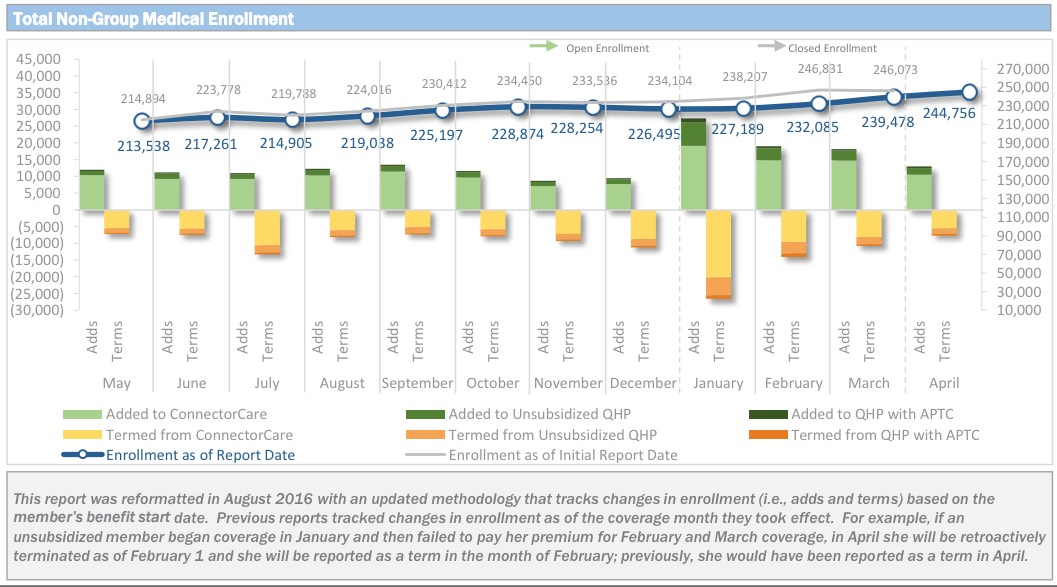
Until today, the only state I know of which separates out the number of people who drop out and sign up each month is the Massachusetts Health Connector, which produces handy reports like this one most months:
Earlier today, however, I was tipped off to a presentation given by some CMS employees last year which included, among other things, a whole bunch of helpful data about enrollment, monthly effectuation rates and so forth...including exactly what I was looking for. The only caveat is that a) much of this only applies to 2015 (with some 2016 info included), and b) much of it only includes data from the federal exchange (HealthCare.Gov), which only covered 37 states in 2015.
However, those 37 states represent around 75% of total ACA exchange enrollment, so it's still a pretty good guideline; in most cases the national total should be roughly 33% higher than the data below.
First of all, here's the Special Enrollment Period (SEP) breakout for HealthCare.Gov in 2015 only. Around 1.6 million people enrolled via SEPs between 2/23/15 - 11/15/15, or an average of just over 6,000 per day (~8,000/day nationally, smack in the middle of the 7,000 - 9,000/day range which I was projecting 2 years ago, I should note!)
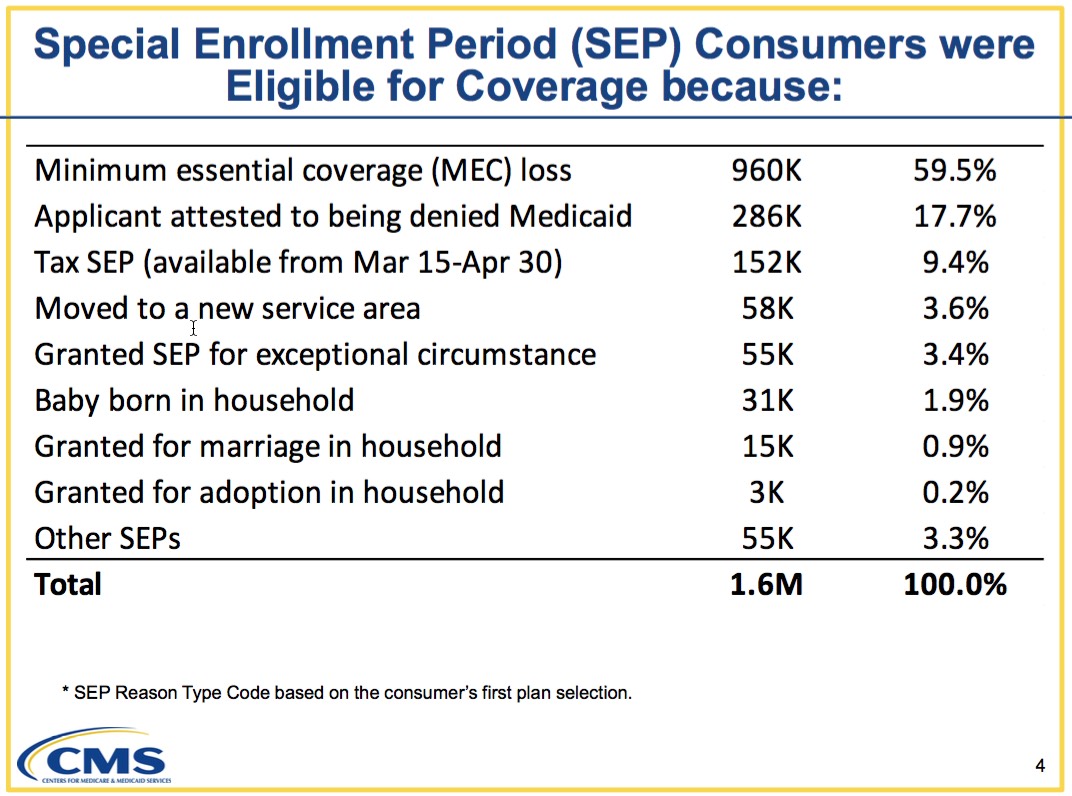
As you might expect, nearly 60% of SEP enrollees qualify due to losing their existing coverage for one reason or another (mostly losing their job, I would imagine).After that comes "denied Medicaid", which I assume refers to people who thought they were eligible due to their income being below 138% FPL in expansion states but turned out not to be after all for other reasons.
The third most frequent QLE in 2015 was the "Tax Filing Season" SEP which ran for 6 weeks in March and April only. This was a one-time thing, however; it was granted because 2015 was the first year that people had to actually pay the Individual Mandate penalty, and so many people complained that they didn't know about it (which I find hard to believe) that CMS gave them a second chance to do so. Some of the state exchanges did as well; the national total "ACA TaxTime SEP" ended up enrolling around 214,000 people nationally.
After that, the numbers drop off rapidly. Far fewer people signed up due to moving than I'd expect, for instance, and even babies/adoption only made up around 2.1% of the total. If you remove the TaxTime SEP for subsequent years, that would change the ratios to something like:
- Coverage Loss: 66%
- Medicaid Denial: 20%
- All Other Reasons: 14%
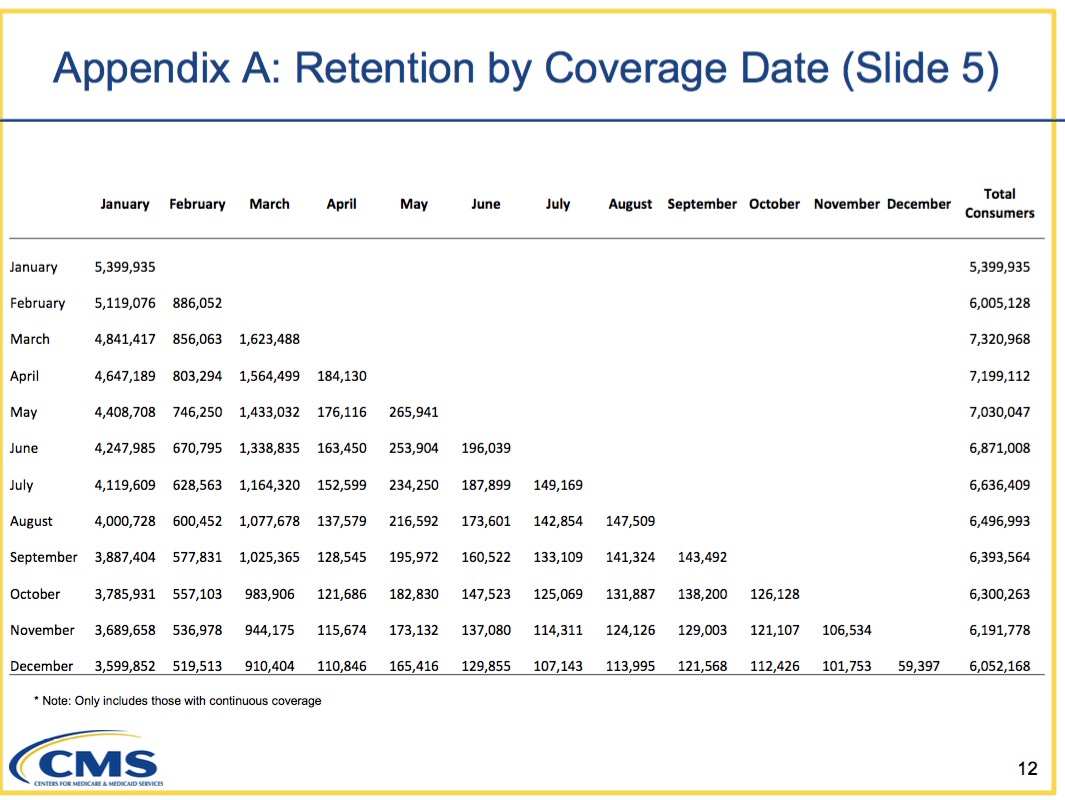
OK, with that out of the way, here's the most important part of this post: Monthly retention from January - December broken out by start date! (the actual effectuation numbers are in the 2nd table below the graph)
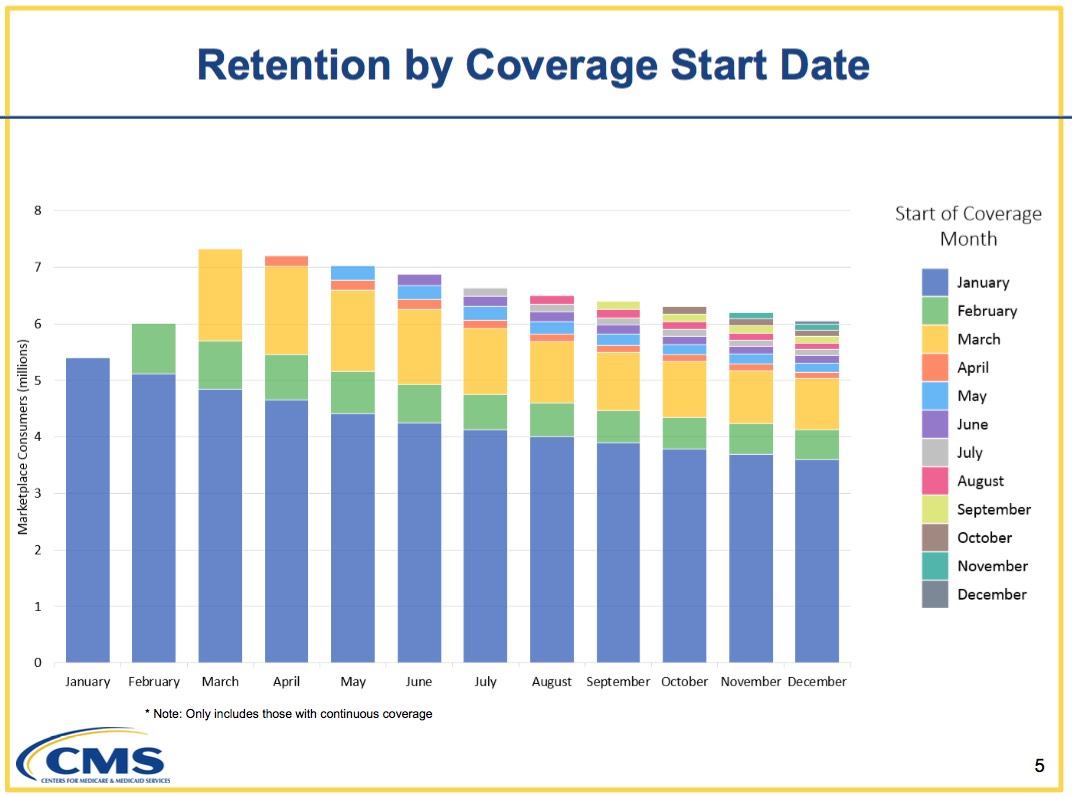
This graph shows that in 2015, out of the roughly 6.4 million people who signed up (or renewed) for January 2015 coverage, around 5.4 million were actually paid/enrolled for January (84.4%...lower than my "90% paid" rule of thumb, but keep reading). Of those particular 5.4 million people, 3.6 million of them were still enrolled all the way through December...precisely 2/3 of them (66.7%).
An additional 886,000 enrolled in time for Feburary coverage. A good 126,000 were actually earlier enrollees who missed the January deadline but made their February payment. How do I know this? Because only around 760,000 people even signed up on HealthCare.Gov between late December 2014 and mid-January 2015, the period for February enrollment!
Finally, another 1.6 million more people paid up for March coverage.
In the end, out of 8,838,291 people who signed up for coverage via HC.gov during the 2015 Open Enrollment Period, 7,909,475 paid their first month's premium...or 89.5%. Booyah!!
How about the off-season enrollees (SEP)? Well, the payment/effectuation rate isn't quite as good there: Out of 1,615,000 SEP enrollees on HC.gov between 2/22/15 - 11/15/15, only 1,378,339 paid their first month's premium...or 85.3%. Apparently SEP enrollees are a bit less likely to follow through.
Still, when you add them together, that's 9.29 million paid/effectuated enrollees out of 10.45 million total signups over the course of the year...or 88.9%.
Again, the chart and table only include HealthCare.Gov enrollees, so you have to bump each figure up by about 1/3, but I assume the ratios wouldn't change that much.
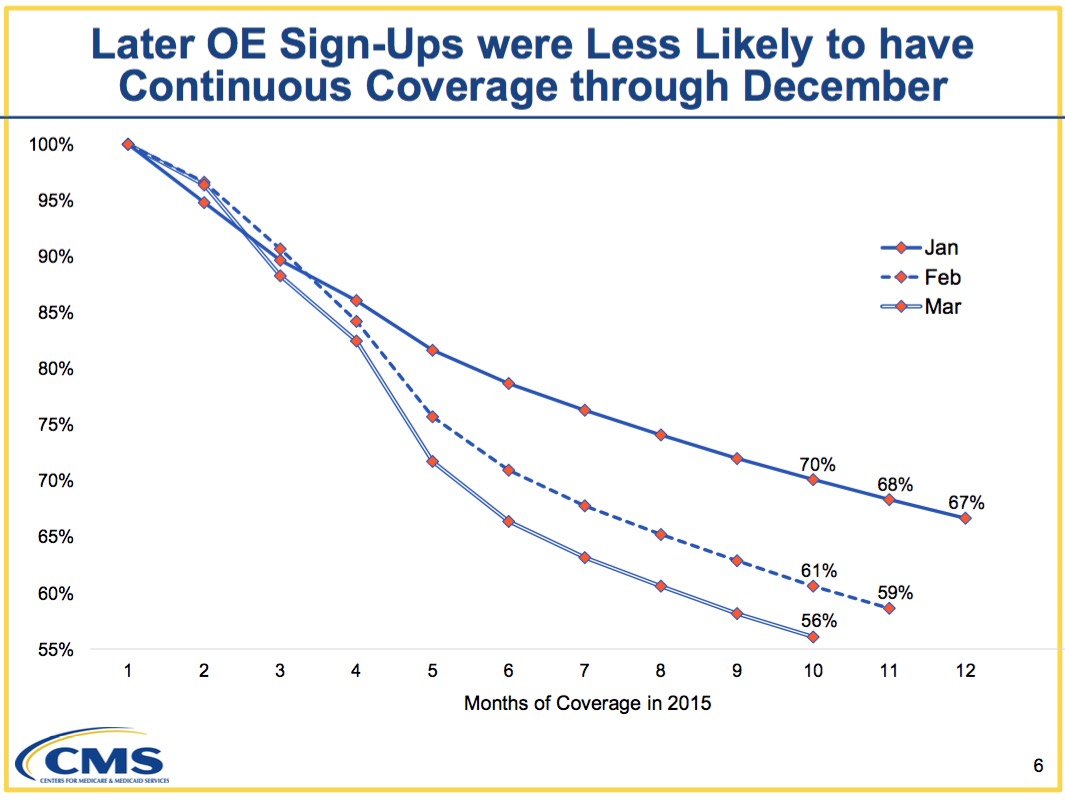
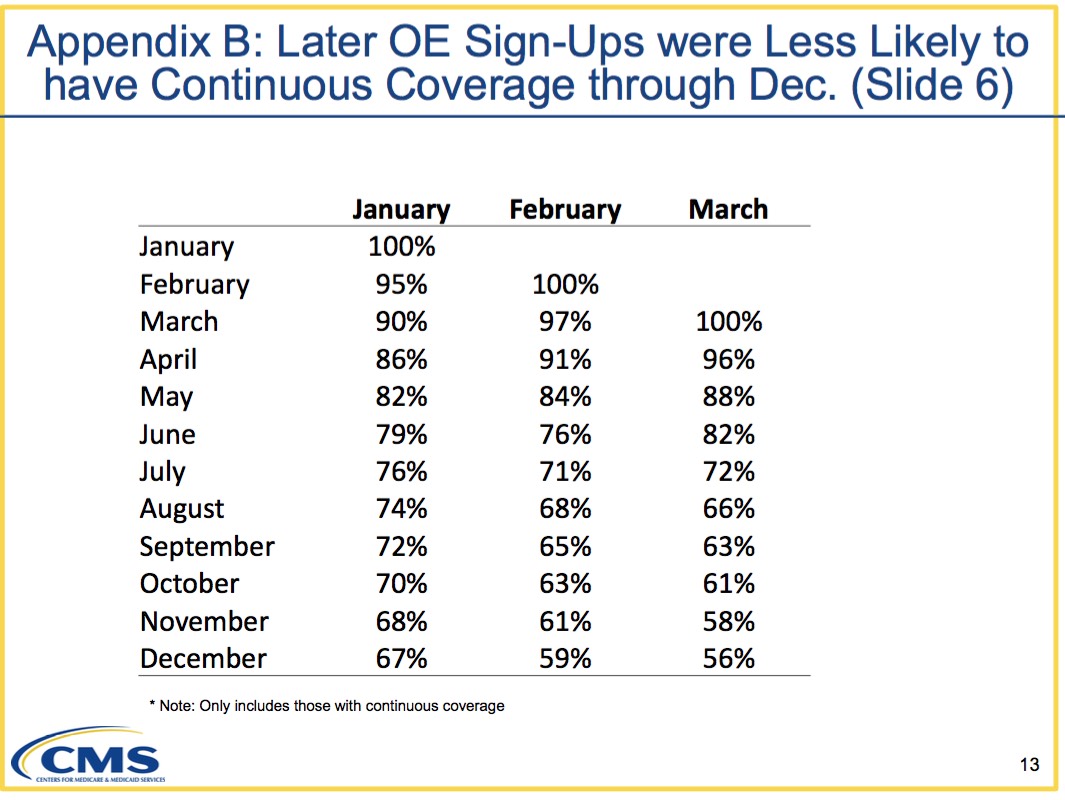
As noted above, 67% of January enrollees stuck it out all the way through the end of the year (this includes people like my own family....people who are on the individual market because we're self-employed, or who work steady jobs for companies which don't provide coverage for us). Interestingly, this retention rate drops off earlier as the start date moves later--only 59% of those who start coverage in February stick it out, while only 56% of March-start enrollees do so. This may be due to "SEP gaming" as many in the industry claim, but it could also be partly because the young invincible crowd (18-35) tend to enroll at the last minute...and I'm guessing younger folks are also more likely to drop coverage earlier, whether due to not being able to keep up with the payments or because they're more likely to be seeking a job (w/benefits) or getting married (to someone w/coverage?) throughout the year. Whatever the reasons, this helps explain both why the insurance carriers keep screaming about cracking down on SEPs. They want people to sign up starting in January and to keep paying their premiums for all 12 months.
Advertisement
