

BREAKING: CMS appears to have ignored 500K exchange enrollees to issue misleading effectuation rate
Mon, 06/12/2017 - 2:32pm
Every summer for the past few years, the CMS division of the HHS Dept. has released a quarterly report stating how many ACA exchange enrollees are still enrolled in effectuated policies as of March 31st of that year.
The precise wording of this is important, because (as Republicans and other ACA detractors have been shouting about since day one), just because someone signus up for a healthcare policy doesn't mean that they actually pay their first month's premium to be enrolled...and even if they do, some of them will then drop their policy a few months later for any number of reasons (new job with benefits, moving to a different state, turning 65 and moving to Medicare, falling on hard times and qualifying for Medicaid or, in some cases...dying).
The first year of ACA Open Enrollment, running from 10/1/13 - 3/31/14, was a bit of a mess, due not only to the technical meltdown at launch but also the whole system being brand-new to everyone on the individual market. A full six months was given for the enrollment period, and even then there was so much pent-up demand at the end of March that an extra 2 weeks was tacked onto the end, for a total Open Enrollment period of 197 days.
For the 2nd and 3rd Open Enrollment Periods, the timeframe was cut in half to 3 months: 11/15/14 - 2/15/15 (plus a 7-day "overtime" period tacked on the end, for a total of 100 days) and 11/1/15 - 1/31/16 (plus one extra day, for a total of 93 days). Last fall was the first OEP which started and ended on the same dates 2 years in a row (11/1/16 - 1/31/17), minus the extra day being tacked onto the end. However, aside from those slight discrepancies, the 2015, 2016 and 2017 OEPs have been roughly the same length, with similar start/end dates, and therefore an effectuation pattern has started to emerge.
As of 2/22/15, 11,688,074 people (around 11.7 million) had signed up for an exchange policy...but only around 10.2 million were still effectuated as of 3/31/15 (37 days later), a drop of roughly 12.8%.
As of 2/01/16, 12,681,874 people (around 12.7 million) had signed up for an exchange policy...but only 11.1 million were still effectuated as of 3/31/16, 59 days later...a drop of roughly 12.6%.
Note that the 2015 report was released on June 2nd; the 2016 report was released on June 30. Today is June 12th, so there's no logical reason why the 2017 Q1 report wouldn't also run through the end of March, right?
Unfortunately...that isn't the case:
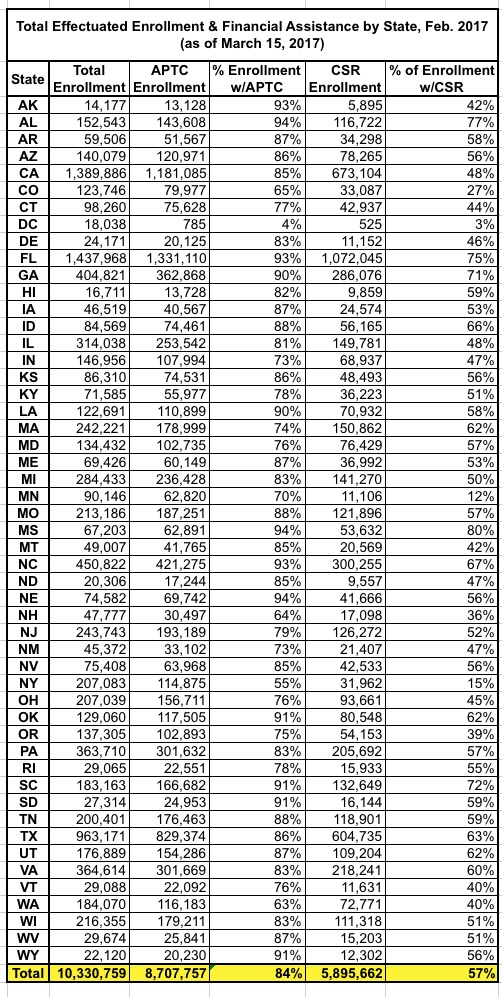
As of March 15, 2017, 10.3 million individuals had effectuated their coverage for February 2017, meaning that they selected a plan that started in January or February, and had paid their first month’s premium. It is important to note that this number is significantly lower than the 12.2 million (-1.9 million) individuals, as reported in the March Open Enrollment Report. Therefore, in order to get a complete picture about enrollment numbers, it is more accurate to highlight the number of people who actually paid their premiums than those who simply selected a plan. This number will be adjusted for individuals who effectuate their coverage in March 2017.
As of 1/31/17, 12,216,003 people (around 12.2 million) had signed up for an exchange policy...but according to today's CMS report, only 10.3 million were officially effectuated as of 3/15/17...not 3/31/17. This amounts to a 15.7% net attrition rate, seemingly a worse drop-off rate than the prior two years.
At first glance this might not sound like that big of a deal; what's 16 days?
Well, first of all: It's actually 10,330,759 / 12,216,003...or 84.6%, for a 15.4% net attrition rate (0.3 percentage points better...rounding off numbers is convenient but can make a difference with this sort of thing).
Secondly, there's that 3/15 vs 3/31 discrepancy...and most imporant is the "they selected a plan that started in January or February". It doesn't include people whose policies effectuated starting on March 1st.
Why is that important? Because in 47 states + DC, any policies signed up for between 1/15 - 1/31 didn't start until March. In the other three states (MA, RI & WA), policies signed up for between 1/24 - 1/31 didn't start until March.
How much of a difference does that make? Well, according to my spreadsheet, as of 1/15/17, around 11,719,286 people had signed up for an exchange policy.
That means that if I'm reading the CMS press release correctly (and I admit the wording of it is a bit confusing...deliberately, I suspect), that means that instead of dividing 10,330,759 numerator into the full 12,216,003 denominator, it should only be divided into 11,719,286.
Assuming I'm reading the CMS report correctly, that means that as of 3/15/17, 88.2% of January and February enrollees had paid their first monthly premium. That's a net drop of only 11.8%, a couple of points better than prior years.
What about the other 496,717 people who signed up between 1/16 - 1/31? Well, assuming that 88.2% figure is representative, around 438,000 of them presumably did pay up during the second half of March. The rules on payment deadlines and grace periods vary from state to state and carrier to carrier, I believe; some are stricter than others. In addition, as Wesley Sanders noted via Twitter, many insurance carriers experience a time lag in sending their effectuation reports and so forth.
Now, it's important to note that the 11,719,286 and 496,717 figures may be off slightly, as different ACA exchanges report their numbers at different intervals, and there's often some minor clerical errors cleaned up later on. In addition, as I noted above, the wording of the press release makes me slightly confused as to precisely which payments/enrollments were and weren't included. Finally, it could be argued that 84.6% is only slightly lower than the previous years anyway, so this is much ado about nothing.
However, I can't help but wonder why CMS didn't simply use 3/31 as the cut-off date instead of 3/15 (and include March effectuations instead of only January & February) for this report. There's been plenty of time to gather the 3/31 data as they did in prior years, so that's no excuse.
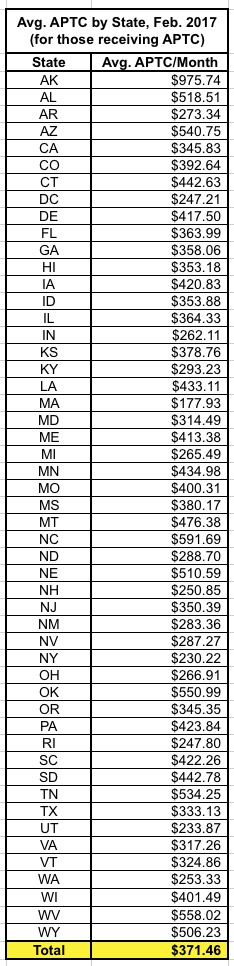
In addition, even the headers on the state tables indicate that these numbers refer only to February effectuation, not March:
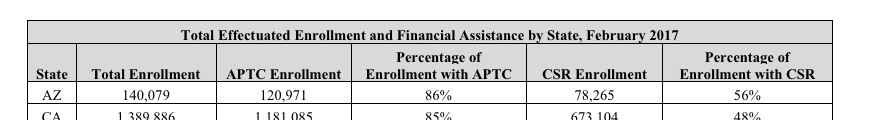
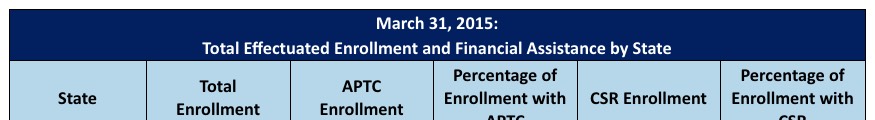
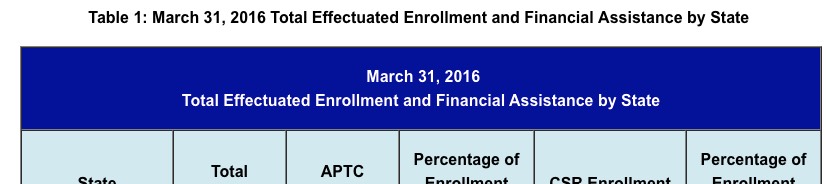
Compare this with the prior Q1 reports:
The only reason I can think of is the same reason as their "105% increase!" report from a couple of weeks back: To provide data which is technically accurate...but also highly misleading.
One more thing: After a lot of research and data analysis over the years, I've concluded as a general rule of thumb that around 88% of enrollees paid their first premium for 2014, improving slightly to around 90% even since then as bugs were worked out, the system got more streamlined and as more people have gotten used to how the whole thing works. That means that roughly 10% of the official OEP number every year needs to be lopped off immediately. As for the other 3-4% who drop out by the end of March, those are the folks who do pay for 1-2 months and then drop out for various reasons.
(sigh) Having said all that, what else does Trump's CMS have to say about the ACA exchanges as of mid-March?
Looking historically at the Patient Protection and Affordable Care Act trends from 2014 through 2017, we also see that a significant number of people who effectuate coverage, do not stay in their plans for the full year. In March of 2016, 10.8 million people had effectuated coverage through the Exchanges, and by the end of the year, only 9.1 million remained. The data on drops in effectuated enrollment shows that, on average since 2014, more than a million enrollees per year have dropped their coverage before the end of the plan year. It is also significant to note that the 10.3 million number reported today falls below the HHS projections for annual 2017 effectuated enrollment.1
Yes, the 10.3 million number reported today does fall below HHS projections for annual 2017 effectuated enrollment, which they were expecting to hit around 11.4 million. Of course, a big chunk of that drop-off is due to the clear and obvious sabotage of the Trump Administration and Tom Price's HHS Dept during the critical final week of Open Enrollment (which also happened to be the first week they took office). I'm not pinning all of the drop-off on them; total enrollment would likely still have been about somewhat shy of expectations even had Hillary Clinton won...but a good half-million or so of it fall squarely on their heads.
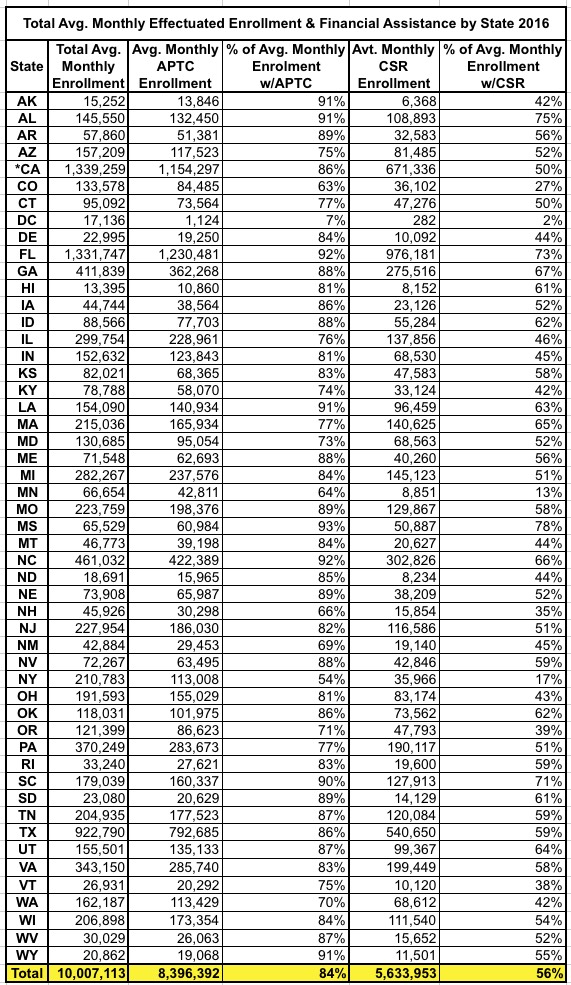
This report also shows that the proportion of the population that enrolls on Federal and State-Based Exchanges and qualifies for financial assistance in the form of advance premium tax credits (APTC) or cost-sharing reduction (CSR) has remained relatively stable. However, the average amount of APTC per eligible enrollee has risen 28 percent when compared with the 2016 average APTC per eligible enrollee. 1
This is hardly surprising; the APTC/CSR ratios have stayed pretty steady every year...and yes, APTC going up 28% makes perfect sense since unsubsidized individual market premiums went up an average of around 23% (I have it down at 25%, but that includes off-exchange plans and some other variables). As I've noted before, due to the way the benchmark plan premiums play into the tax credit formula calculation and for other reasons, some tax credits increased more than the underlying premiums.
Background Information The primary sources for the February 2017 effectuated enrollment are payment and enrollment data. Effectuated enrollment is the total number of individuals who had an active policy in February 2017, and who paid their premium (thus effectuating their coverage) as of March 15, 2017. This data includes effectuated enrollment from both State-Based and Federally-Facilitated individual market Exchanges.
APTC enrollment is the total number of individuals who had an active policy in February 2017, who paid their premium (thus becoming effectuated), and who received an APTC subsidy. APTC is generally available if a consumer's household income is between 100 and 400 percent of the federal poverty level, and certain other criteria are met. A consumer was defined as having an APTC if the applied APTC amount was greater than $0; otherwise, a consumer was classified as not having APTC.
CSR enrollment is the total number of individuals who had an active policy in February 2017, who paid their premium (thus effectuating their coverage), and received CSRs. A CSR is generally available if a consumer is eligible for APTC, has a household income between 100 percent and 250 percent of the federal poverty level and the individual chooses a health plan from the silver plan category. Those who qualify have reduced out-of-pocket costs. American Indians and Alaskan Natives are eligible for CSRs under different criteria.
Nothing new here, just confirming that March-effectuation enrollments do not appear to be included, which again means they don't seem to be including the final 500K or so enrollees.
OK, what else?
Well, they also go into the average monthly effectuation number, which is the only one which really matters to the Congressional Budget Office.
The average monthly effectuated enrollment in 2016 was 10 million individuals. While effectuated enrollment was over 10.8 million in March of 2016, enrollment had dropped to 9.1 million by December of 2016. This is the first year that the average monthly effectuated enrollment is being released, in part, to create a single number that can be compared to other sources such as the Congressional Budget Office (CBO). In CBO’s 2016 report, projected enrollment in the Exchanges was expected to be 15 million.3 However, in 2017, CBO revised their numbers down to be more in line with actual enrollment numbers that had been observed in 2014, 2015, and 20164 . This adjustment was primarily due to more people maintaining employer sponsored coverage than expected.
I have no problem whatsoever with releasing this data (as long as it's accurate). I attempted to do exactly this myself for 2014 and 2015, and am pretty sure that my estimates are fairly close to the mark (although these are national, not state-by-state).
The primary sources for the 2016 average monthly effectuated enrollment are payment and enrollment data. These data represent the average monthly number of unique individuals who had an active policy in 2016 and who had paid their premium (thus becoming effectuated) as of March 15, 2017. This was calculated by total member months divided by 12. Data include effectuation from both Federal and State-Based Exchanges.
2016 average monthly APTC enrollment is the average number of unique individuals who had an active policy in 2016, who had paid their premium (thus becoming effectuated), and who received an APTC subsidy. APTC is generally available if a consumer's household income is between 100 and 400 percent of the federal poverty level, and certain other eligibility criteria are met. The average monthly number of effectuated enrollments was calculated by total member months divided by 12.
2016 average monthly CSR enrollment represents the average number of unique individuals in 2016 who paid their premium (thus becoming effectuated), and receive cost-sharing reductions. CSR is generally available if a consumer is eligible for APTC, has a household income between 100 percent and 250 percent of the federal poverty level, and the individual chooses a health plan from the silver plan category. Those who qualify have reduced out-of-pocket costs. American Indians and Alaskan Natives are eligible for CSRs under different criteria.
Advertisement
