

2020 Week Seven HC.gov Snapshot Report: 4.42M QHPs, 8.3M Cumulative
Fri, 12/20/2019 - 2:09pm
Normally the Weekly HC.gov Snapshot Reports are released on Wednesdays. This week it was delayed until Friday in order to include the extra 2 1/2 days:
- The final official day (Dec. 15th) fell on a Sunday this year
- The additional 36 hour extension from 3pm on Monday 12/16 - midnight Eastern on Wednesday 12/18*
Not only is "Week 7" actually 9.5 days, but the final week of Open Enrollment also always includes a last-minute enrollment surge as people scramble to beat the deadline (both the original and the extension). In addition, it's also traditionally the week that CMS adds all of the auto-renewals to the report for current enrollees who neither actively selected a policy for 2020, nor did they cancel their coverage for the new year.
As a result of these factors, the numbers for Week 7 understandably dwarf each of the previous snapshot reports:
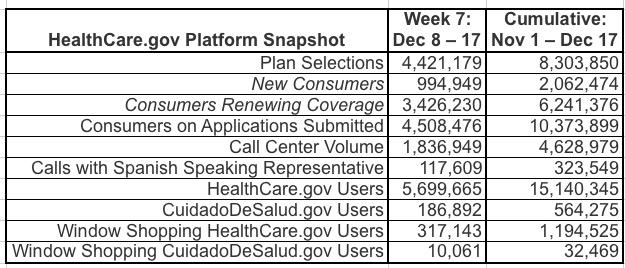
Week 7, Dec 8-17, 2019
In week seven of the 2020 Open Enrollment, 4,421,179 people selected plans using the HealthCare.gov platform or were automatically re-enrolled in a plan. Typically, enrollment weeks are measured Sunday through Saturday. However, the deadline to sign up for January 1 coverage was extended until 3:00AM EST on December 18, to accommodate consumers who attempted to enroll in coverage before the deadline and were unable to complete the enrollment process. This week’s snapshot accounts for both week seven and the extension period. Consequently, it is measured Sunday through Tuesday.
This Open Enrollment snapshot covers the period from December 8, 2019, to 11:59PM Eastern Time on December 17, 2019. The plan selections reported in this snapshot are not final and do not include plan selections for consumers who enrolled in coverage between 12:00AM and 3:00AM ET on December 18, 2019, or consumers who left their contact information at the call center due to high volume. Similar to previous years, the Centers for Medicare & Medicaid Services (CMS) plans to release an updated snapshot during the second week of January with the final enrollment data.
*As noted, the extension period actually lasted another 3 hours, until midnight Pacific; those last-minute enrollees aren't included in this report, so the final tally will likely be slightly higher. This will, however, be at least partly cancelled out by subtractions of some data cleanup (bad entries, last-minute cancellations, people purged due to having legal residency issues, etc). Last year around 43,000 enrollees were dropped from the final, official total on HealthCare.gov.
These snapshots provide point-in-time estimates of weekly plan selections, call center activity, and visits to HealthCare.gov or CuidadoDeSalud.gov. The final number of plan selections associated with enrollment activity during a reporting period may change due to plan modifications or cancellations.
This week’s snapshot reports new plan selections, active plan renewals, and automatic enrollments. It does not report the number of consumers who have paid premiums to effectuate their enrollment, and it does not include plan selections from State-based Exchanges, other than those using the HealthCare.gov platform.
As we do each year, CMS also plans to release a detailed 2020 final enrollment report in March, including final plan selection data from State-based Exchanges that do not use the HealthCare.gov platform.
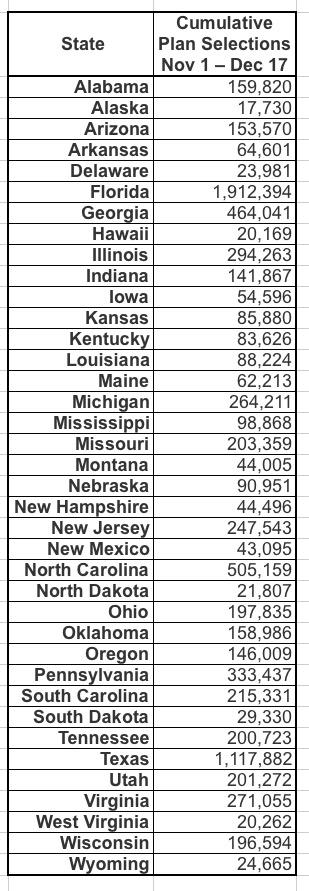
HealthCare.gov State-by-State Snapshot
The state-by-state Snapshot provides cumulative individual market plan selections for the 38 states using the HealthCare.gov platform for the 2020 benefit year. Cumulative individual plan selections for the states using the HealthCare.gov platform include:


OK, so there you have it...there will be some last-minute tweaks to the data, but the final HC.gov numbers will likely be within a few tens of thousands of enrollees higher or lower nationally than what you see above.
Here's the week by week breakout across all 38 states. I've also compared the 2020 Open Enrollment numbers against the 2019 data, and have even accounted for the fact that Nevada split off onto their own state-based exchange this year:
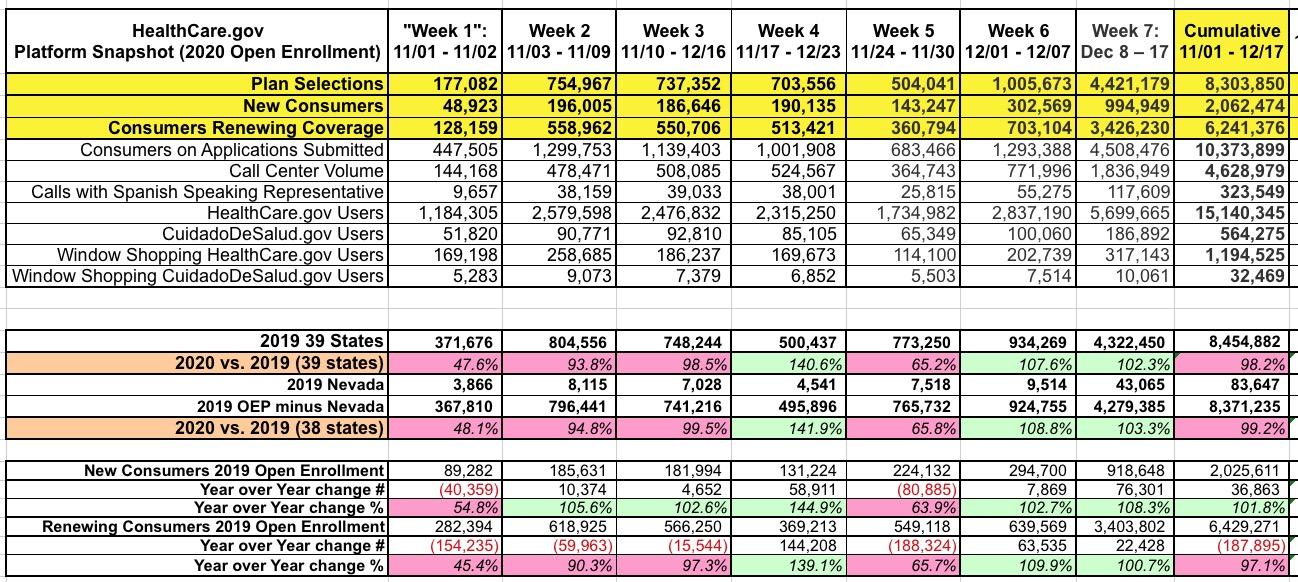
As you can see, total HC.gov enrollments ended up down just 1.8% year over year (151,000 people)...and after you account for Nevada (which you really should), it's down only 67,000 people, or 0.8%
That still continues the downward trend which we've seen every year since the Trump Administration took office, but it's a much smaller decline on both a percentage and raw number level, so that's good, I suppose.
Unfortunately, the New/Renewal breakout doesn't let me subtract Nevada, so those numbers are slightly skewed, but overall:
- NEW enrollees are up 1.8% year over year (2,062,474 vs. 2,025,611...around 37,000 more)
- RENEWING enrollees are down 2.9% year over year (6,241,376 vs. 6,429,271...around 188,000 fewer)
What about the state-by-state data?
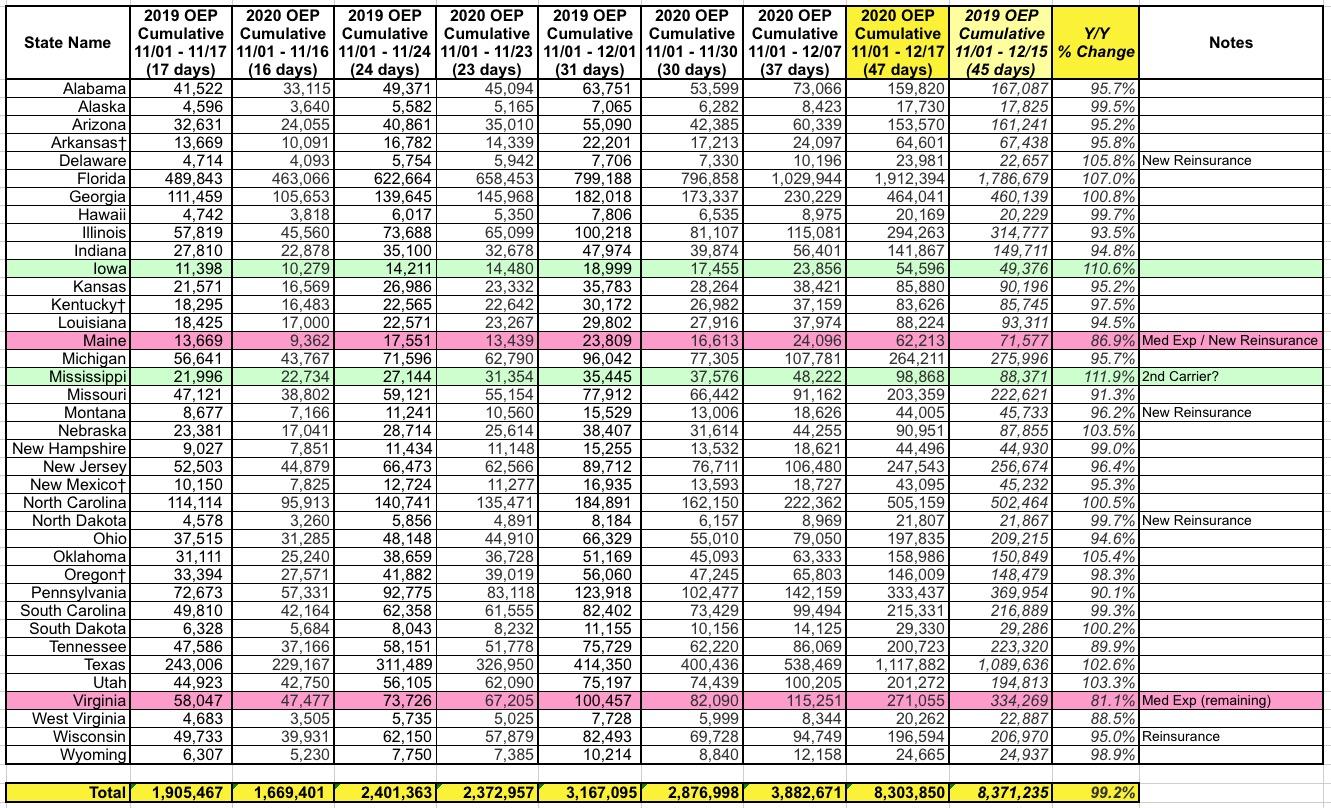
As I expected, the worst-performing states relative to last year are Maine and Virginia, which are down 13% and 19% respectively. This makes sense since both state expanded Medicaid this year, which means a big chunk of their exchange enrollees (earning 100 - 138% FPL) have been/are being transferred over to Medicaid instead.
The best-performing states are Mississippi and Iowa, increasing enrollment by 12% and 11% respectively. Iowa kind of makes sense since they're seeing a significant average unsubsidized premium reduction of 11% statewide, but I still have no clue what's going on in Mississippi. Whatever...good for them!
The next top performer is Florida, which continues to kick butt each year.
Advertisement
