

My Half-Assed (VERY crude) attempt to figure out how much Medicare for America might cost
Mon, 05/20/2019 - 11:20am
WARNING: I can not emphasize enough just how many assumptions I'm making here. I could be ABSURDLY off at either end of the scale; the actual cost could turn out to be half as much as I project here...or twice as much. This is purely a crude, early attempt to game out the basic framework for determining the actual cost, and there's a lot of missing data, which means having to make some pretty big assumptions about the current situation, much less projecting things forward.
All of this being said, I decided to take a crack at figuring out just how much additional federal spending might be needed in order to properly fund the "Medicare for America" universal healthcare coverage proposal.
I did this because of an interesting paradox: The Bernie Sanders/Pramila Jayapal "Medicare for All" bills have had several cost projection studies done by serious policy think tanks...but has no actual payment mechanism baked into the legislation itself (beyond repurposing existing federal healthcare spending dollars, which would only account for perhaps 30% or so of the cost at most). On the flip side, the Medicare for America bill includes very specific payment mechanisms within the legislative text itself...but I'm not aware of any major cost analysis which has been done for the bill as of yet.
With that in mind, I decided to tackle it myself purely as a fun exercise. I'm deliberately posting this before discussing it with anyone at either Rep. DeLauro or Rep. Schakowsky's offices (they're the two co-sponsors of the legislation) or the Center for American Progress (which worked with them to develop the bill) in part because I'm curious to see just how far off my extremely crude estimates are from whatever internal cost analysis they've done, as well as whatever the CBO or third-party think tanks may come up in the future.
It's also important to keep in mind that this legislation has zero chance of being passed and signed into law until 2021, which means Year 1 would be 2022 at the earliest. That's important for purposes of population size, inflation and so forth.
OK, so the first thing to figure out is the gross cost of such an overhaul. That is, how much would it cost if there were no cost sharing of any sort for anyone enrolled in the program, "Medicare for All"-style. Remember, Med4America would start out essentially as a robust public option added to the existing ACA exchanges, along with some beefed-up subsidies. The ACA is expected to spend around $126 billion on APTC subsidies in 2022 & 2023 combined (remember, CSR reimbursements have been cut off and rolled over into additonal APTC subsidies instead). Expanding & enhancing the subsidies to another 5 - 10 million people or so might double this amount for those first two years, so let's call it an additional $125 billion for years 1 and 2.
- Estimated additional cost for first 2 years: $125 billion
It's year 3 (2024) where the Med4America program proper would really kick into effect, including the addition of dental, vision and optical coverage, long-term services & support and so forth. Year three is when the existing Medicare enrollment base, the existing ACA individual market, the existing "junk plan" market and the 30 million or so uninsured would be transferred over to the new program. It's also when newborn children and those newly turning 65 would be auto-enrolled. This should amount to perhaps 30% of the entire population in years 3 & 4.
Year 5 (2026) is when the new Med4America program would absorb the existing Medicaid/CHIP program. This, combined with the ability of small businesses to voluntarily transfer their employees over to the new program (or for employees of those businesses to do so on their own) should mean that at least 55% of the entire U.S. population would have been shifted over to Med4America by that point, or around 192 million people as of 2026.
Year 7 is the point when large employers would have the option of moving employees over and paying a flat 8% payroll tax, but that's a complete unknown, and all of the major features of the program (as well as all mandatory transferees) would already be in place, so I'm using that Year 5, 55% enrollment marker as my baseline. That is, I'm going to try and figure out how much Medicare for America might cost in that year, then work backwards and forwards to figure out the full, 10-year cost.
According to the National Health Expenditure Report, by 2026 the total U.S. population will have grown to around 350 million people, and total national health expenditures (under current law) will have grown to around $5.65 trillion per year, or over $16,000 per person. That's around 48% more than this year, by the way. Current Medicare enrollees (primarily those over 65) cost a good three times as much on average per capita to treat than those under 65 do, and they'd make up a disproportionate chunk of that 192 million (around 34% vs. just 19% of the total population), so I'm going to assume an average base cost per Med4America enrollee of perhaps $20,000 apiece in 2026.
If so, that would make the grand total gross cost for treating all 192 million people around $3.84 Trillion for that year.
IMPORTANT: This assumes no cost savings from lower healthcare provider reimbursement rates, reduced expenses thanks to improved preventative care, reduced ER visits since no one would have to rely on the emergency room for basic services, increased efficiency and so forth.
OK, that's the relatively easy part. Now we have to subtract:
- the amount of federal spending currently projected to be spent on Medicare, Medicaid, CHIP and ACA subsidies;
- the amount of state spending currently projected to be spent on Medicaid and CHIP via the Maintenance of Efforts provision; and
- the amount projected to be paid by the 192 million enrollees via premiums and other cost-sharing (co-pays & coinsurance...Med4America has no deductibles)
Again, according to NHE projections, under current law, the U.S. federal and state governments combined are expected to spend around $1.34 trillion on Medicare and $937 billion on Medicaid in 2026. In addition, the CBO projects roughly $74 billion in ACA premium subsidies + Basic Health Program spending combined by the federal government in 2026.
Subtract those out and you're down to around $1.489 trillion for 2026 specifically.
Now comes the trickiest part: How much would the actual enrollees themselves be contributing in the form of premiums and out-of-pocket spending?
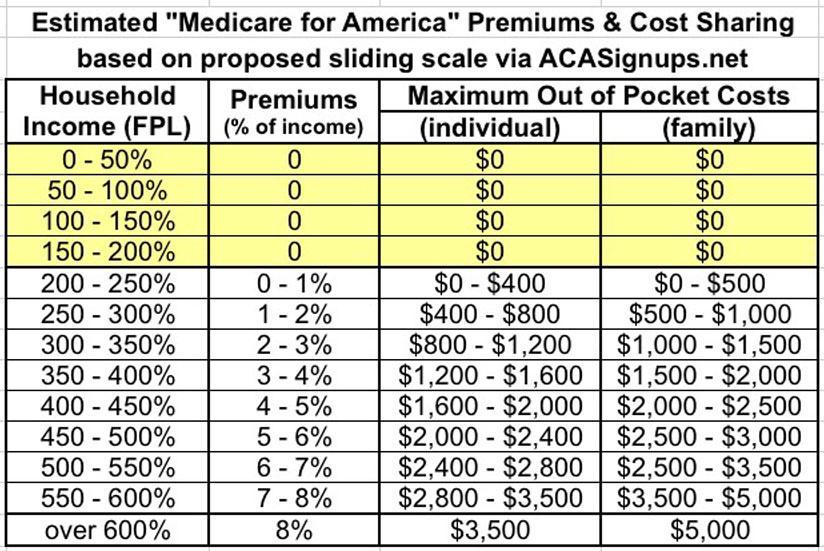
Well, let's take another look at how the Med4America premium/cost sharing formula would work:
Premiums, to be established by the Secretary, will be no more than 8% of individuals’ or households’ monthly income. Current Medicare beneficiaries will pay either Medicare’s premium (how it is presently calculated) or Medicare for America’s, whichever is cheaper. And, individuals and families between 200 and 600 percent of the Federal Poverty Level will receive subsidies. Those below 200 percent will have no premiums or cost-sharing. There will be no deductibles under Medicare for America. Maximum out of pocket costs for an individual (including seniors and current Medicare beneficiaries) will be $3,500; $5,000 for families (based on a sliding scale for individuals and families between 200 and 600 percent of the Federal Poverty Level).
I put together a simple table which boils the above down to what I think it would look like:
My friend and fellow healthcare wonk Andrew Sprung pointed me towards this 2017 U.S. Census Bureau report where it breaks the U.S. population down by household income bracket relative to the Federal Poverty Level (page 28):
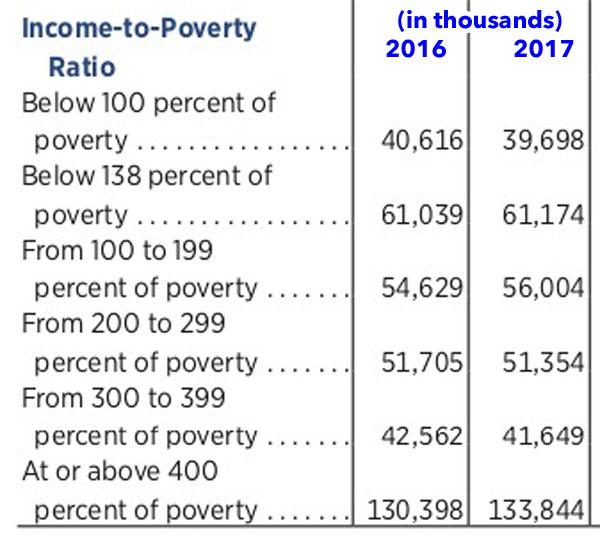
That's 30% of the population earning less than 200% FPL, so they wouldn't pay anything. Another 16% earn 200-300% FPL; 13% earn 300-400% FPL and the remaining 41% earn more than 400% of the federal poverty line.
Unfortunately, it doesn't break things out over the 400% threshold, but I've been able to kind of/sort of break that out (see below) into a 400 - 700% FPL range and the over 700% population.
If you adjust for population size (remember, we're assuming 350 million people as of 2026), that's:
- 104 million < 200% FPL;
- 56 million 200-300%;
- 45 million 300-400%;
- 63 million 400 - 700%; and
- 82 million > 700% FPL
If we assume the 55% of the population which would be enrolled is representative within each group (which it likely wouldn't be), that translates into:
- 56 million <200% FPL;
- 31 million 200-300% FPL;
- 25 million 300-400% FPL;
- 35 million 400 - 700% FPL; and
- 45 million > 700% FPL.
NEXT: What's the average household size within each of these income brackets? In 2019, 100% FPL for a couple is $16,910. For a family of three it's $21,330. Splitting the difference would give an average of around $19,120 per household.
The national average of roughly 2.53 people per household. However, lower-income households do tend to have more children than higher-income women, although the gap isn't nearly as high as stereotypes would suggest. As of 2015, households earning less than $10,000/year had a birthrate of 65 per 1,000 women, vs. 43 per 1,000 for households earning over $200,000/year.
I have been able to roughly break out the average household size, by income level, based on different birth rates at income levels. Combining the link above with this excellent American Housing Survey database tool (again, a big shout-out to Andrew Sprung for the link!), I get the following:
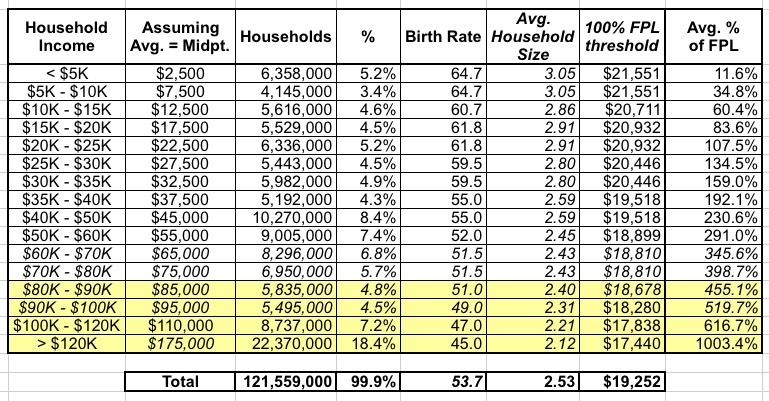
What about inflation? The Federal Poverty Level threshold increases by perhaps 1.8% per year; I'm assuming that as of 2026, the Federal Poverty Level will be perhaps 12% higher than it is today...but presumably incomes at the various levels will be as well (I certainly hope so...).
Again, I'm not sure what the actual income distribution is within these income brackets, but if you take the midpoint of each, you get:
- 250% FPL = $52,500
- 350% FPL = $73,500
- 550% FPL = $110,000
But what about those earning more than 700% FPL? Again, unfortunately I have no idea what the spread is. For purposes of this analysis, I'm going to assume an average household income of 850% for this portion of the population, which would be around $150,000 for an average 2.1 person household in 2026.
Using these midpoints and the premium/OOP table above, that would translate into something like 1.0% of income, 3.0%, 7.0% and 8.0% of income for premiums, and $500, $1,500, $3,500 and $5,000 in maximum out of pocket expenses for the brackets on average.
Multiply it all out and you'd get something like the following. First, premiums:
- 31 million x $525 in premiums/yr = $16.3 billion
- 25 million x $2,205 in premiums/yr = $55.1 billion
- 35 million x $7,700 in premiums/yr = $270 billion
- 45 million x $12,000 in premiums/yr = $540 billion
- TOTAL: $881 billion
Subtract that from $1.489 trillion and you're at around $608 billion per year.
Next, co-pays and coinsurance. I'm going to assume that all 192 million average say, 80% of their Maximum Out of Pocket amount. Is this realistic? I haven't a clue, but if so, that'd give you:
- 12.4 million households x $400 OOP = $5 billion
- 10 million households x $1,200 OOP = $12 billion
- 15.2 million households x $2,800 OOP = $42.5 billion
- 21 million households x $4,000 MOOP = $84 billion
- TOTAL: $144 billion
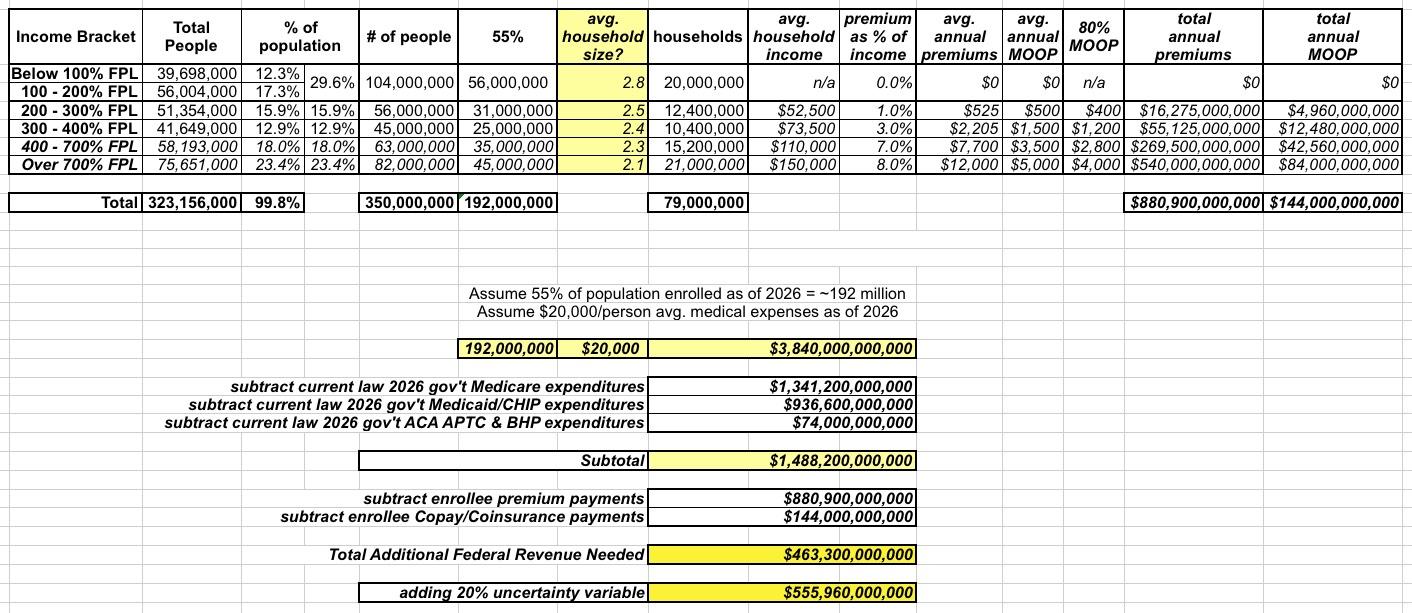
Subtract that from $608 billion and the final, net additional federal spending needed for 2026 specifically would be around $470 billion at the low end.
If you tack on another 20% to account for the huge variables and unknowns, you'd be looking at around $560 billion at the high end.
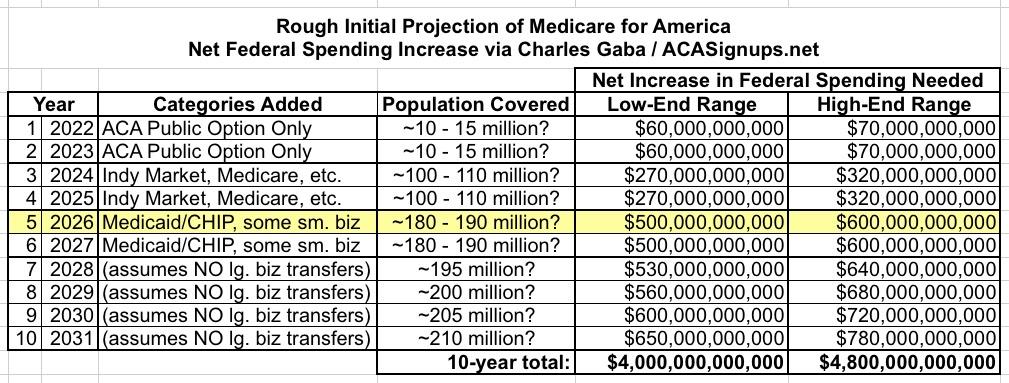
Click the table below for a higher-res version which boils down all the above methodology and assumptions:
Using this as a rough baseline for 2026 specfically (and throwing on another $30 billion or so just for the hell of it), I've also gone ahead and retrofitted Years 3-4 and years 6-10 to give a very rough projection about what the 10-year CBO score might look like from 2022 - 2031. Note that I'm assuming that there isn't any significant transfer of employees working for large companies...the assumption here is that the only additional enrollment growth after Year 6 would come from normal population growth (newborn children, people turning 65, etc).
Assuming I'm reasonably close in all my estimates (which, again, is a huge assumption), my very rough estimate is that it'd cost somewhere between $4 - $4.8 Trillion in additional federal spending over a decade.
This may sound low, but it's important to keep in mind that:
- First, it assumes that 45% of the country wouldn't be enrolled in it at all. Every large company which shifts their employees over to it would increase the cost...immediately cancelled out by the 8% payroll tax they'd be paying to cover the additional expenses.
- Second, a large chunk of the expenses for 3/4 of the enrollees is already being covered via existing federal & state Medicare, Medicaid, CHIP & ACA spending.
- Third, remember that the first two years, Medicare for America would mostly amount to a robust individual market public option only with some beefed-up subsidies
Again, I could be wildly off on many of the above assumptions. If anyone has reliable, comprehensive data which is significantly different from any of my numbers above, feel free to send it my way and I'll consider re-running my analysis. I think I'm somewhere in the ballpark, though.
Advertisement
