New York: 2017 Premiums STILL around HALF as much as 2013 rates, for a simple reason...
Back in early June, I took the misleading, disingenuous, incomplete report from Trump's ASPE head which tried to make it appear that the Affordable Care Act had caused individual market health insurance premiums to "more than double" by 105%.
Regular readers may recall that this study was deeply flawed in several ways:
- First, it only included 39 states.
- Second, it only includes the on-exchange portion of the individual market, not off-exchange enrollees.
- Third, it doesn't take into account that around half the individual market enrollees receive tax credits to cut down on their premiums
- Fourth, it doesn't take into account that this is an utterly apples to oranges comparison, since only 7 states had guaranteed issue laws on the books before the ACA, and only one (New York) also had a community rating law in place. The other 43 (+DC, I believe) were allowed to cherry-pick their customers, kicking those with pre-existing conditions to the curb (a few, like my home state of Michigan, did require their non-profit Blue Cross to act as a carrier of last resort).
Anyway, I went ahead and plugged in the missing data for as many states as possible, and determined that after you account for most of the missing states and the tax credit factor, individual market premiums have actually only gone up about 20% on average (although the half of the market which doesn't receive tax credits is paying about 95% more on average, which is a real problem).
Unfortunately, aside from not knowing the average off-exchange premiums for any state (which could be higher or lower than the on-exchange unsubsidized averages), I was still missing the District of Columbia and New York. I'm not too worried about DC, since they only have about 22,000 individual market enrollees total anyway, but New York bothered me for a couple of reasons: For one, they had about 243,000 exchange enrollees this year (a significant number); for another, as noted above, they're the only state which mandated both guaranteed issue and community rating before the ACA.
I decided to try and track down the actual 2013 and 2017 average indy market premiums for New York State, and I think I've got it:
DATA POINT ONE: According to this July 17, 2013 press release by the NY Dept. of Financial Services...
On average, the approved 2014 rates for even the highest tier of plans individual New York consumers could purchase on the exchange (gold and platinum) represent a 53 percent reduction compared to last year’s direct-pay individual rates. The fact that these average individual rates are effectively being cut more than in half is primarily because a greater number of uninsured individuals are expected to obtain coverage in the individual insurance market – lowering overall premiums. 1 (Note: That 53 percent reduction does not include the impact of federal financial assistance for individuals meeting certain income thresholds who are purchasing coverage on the exchange, which would lower costs even further for many consumers.)
... It is challenging to compare existing premium rates to those that have been approved for 2014. The 2014 health insurance plans are for new products with new rates. However, plans in the existing “direct-pay” market where individual New York consumers who do not have insurance through their employer can purchase coverage have relatively uniform terms with high standards for the level and quality of coverage provided. These existing “direct-pay” plans are generally comparable to 2014 gold and platinum plans. For the lower-cost tiers of individual coverage (silver, bronze, and catastrophic), the approved 2014 rates would represent a even greater reduction than 53 percent compared to last year’s average direct pay rates – however, those plans are not directly comparable to existing offerings.
OK, so they're saying that 2014 Gold/Platinum plans were priced 53% lower on average than in 2013, while Silver/Bronze/Catastrophic plans were reduced by an "even greater" level. I'm going to go with, say, 55% lower on average for Silver/Bronze/Catastrophic.
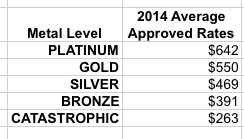
Next, I need to know what those 2014 rates were in order to reverse engineer what the 2013 rates averaged out at. Fortunately, the same press release included this handy PDF which breaks out the average approved 2014 prices at each metal level. I have no idea what the weighted averages by carrier market share was, but here's the unweighted average for each tier:

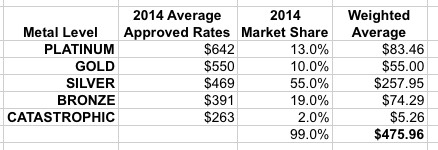
Next, I need to know the relative market share at each metal level in 2014. According to this 2014 Open Enrollment Report, the breakout was:
Qualified Health Plan Enrollment Level
The Marketplace offers Qualified Health Plans at four different metal levels: Bronze, Silver, Gold and Platinum. Thirteen percent of enrollees are enrolled in Platinum level plans, 10 percent are in Gold level plans, 10 percent are in Silver level plans, 45 percent are in one of three Silver level Cost Sharing Reduction plans, 19 percent are in Bronze level plans, and 2 percent are in Catastrophic level plans.
...which looks like this...or about $476/month on average in 2014:

Since the 2013 press release said that Gold & Platinum plans would be 53% lower on average than 2013 rates, and assuming Silver/Bronze/Catastrophic plans were about 55% lower, that means that New York's 2013 Individual Market premiums looked something like this:

Holy crap on a stick.
I did a double-take when I read this, but it checks out. Here's a Reed Abelson story in the New York Times from July 2013:
Individuals buying health insurance on their own will see their premiums tumble next year in New York State as changes under the federal health care law take effect, Gov. Andrew M. Cuomo announced on Wednesday.
State insurance regulators say they have approved rates for 2014 that are at least 50 percent lower on average than those currently available in New York. Beginning in October, individuals in New York City who now pay $1,000 a month or more for coverage will be able to shop for health insurance for as little as $308 monthly. With federal subsidies, the cost will be even lower.
...The new premium rates do not affect a majority of New Yorkers, who receive insurance through their employers, only those who must purchase it on their own. Because the cost of individual coverage has soared, only 17,000 New Yorkers currently buy insurance on their own. About 2.6 million are uninsured in New York State.
The first time I read this story, I was surprised that they'd use "$1,000 a month" as a typical example...but apparently that was indeed the average at the time.
This brings me to...
DATA POINT TWO: According to the official New York State of Health 2017 Open Enrollment Report:
In 2017, individual premium rates for Qualified Health Plans (QHPs) continue to be nearly 50 percent lower on average than before the establishment of the NY State of Health.2 More than half of QHP enrollees are eligible for financial assistance to help further lower the cost of health plan premiums purchased through the Marketplace. On average, enrollees received $233 a month in federal tax credits to further reduce the cost of coverage. In aggregate, New Yorkers are expected to receive nearly $400 million in tax credits during 2017. Taken together, enrollment in the Essential Plan and QHPs increased by 39 percent between 2016 and 2017, from over 650,000 to over 908,000 people.
They don't specify what "nearly 50% lower" means, but I'm figure that means perhaps 46% lower in 2017 than 2013. The second sentence clarifies that the "nearly 50% lower" is before APTC subsidies are added to the mix, so that's at full price.
So, what would 46% lower than $1,045 be? Around $564/month.
How does that compare to the other data I have for New York in the intervening years?
Well, in 2014, the carriers received an average 5.7% increase for 2015, which would've bumped the $476 up to $503.
Then, in 2015, state regulators approved a 7.1% increase for 2016, which would bring them up to $539.
Finally, last fall, regulators approved an average 16.6% increase for 2017, bringing it up to $628/month on average.
Obviously there's a big discrepancy between these numbers (about $64/month), but it's also important to remember that these were the approved average rate increases, not the effective ones. In 2016, I estimated around a 12-13% average approved rate hike nationally...but also made sure to note that:
Of course, even if I'm 100% on target, the biggest caveat here is that these numbers all still assume that everyone renews their existing policies instead of shopping around, which everyone should do. The lowest-cost plan within a given metal level won't make sense for everyone, but it will for many people, and if a significant number of people switched to a lower-cost policy it would indeed reduce the average rate changes significantly (I could see the effective average rate hike ending up around perhaps 9-10% nationally after the dust settles next spring).
Well, guess what? The Hill, Today:
...The average ObamaCare premium rose to $408 per month for 2016 plans, about a 9 percent increase from this time last year, according to a new report from the Department of Health and Human Services.
Assuming the effective increase in New York each year was 20% lower than the approved increase, that would account for most of the discrepancy above: $499 in 2015, $527 in 2016 and $597 in 2017.
For the moment, I'm going to split the difference and assume New York's average unsubsidized premium is around $580 this year until I hear otherwise.
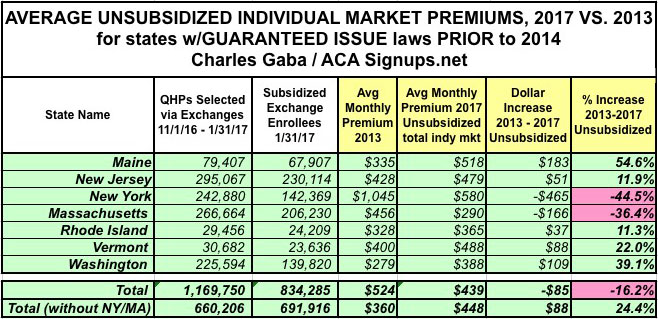
With this in mind, I've plugged my estimates for New York's 2013 and 2017 average premiums into the table, which gives me the following:

And there you have it: Across the 7 states which already had guaranteed issue and/or community rating laws in place just before the ACA rules went into effect, unsubsidized premiums have actually dropped by 16% on average since 2013...or, if you take New York and Massachusetts (special cases) out of the mix, they've only increased by 24%, of which 11.2% has been normal medical inflation.
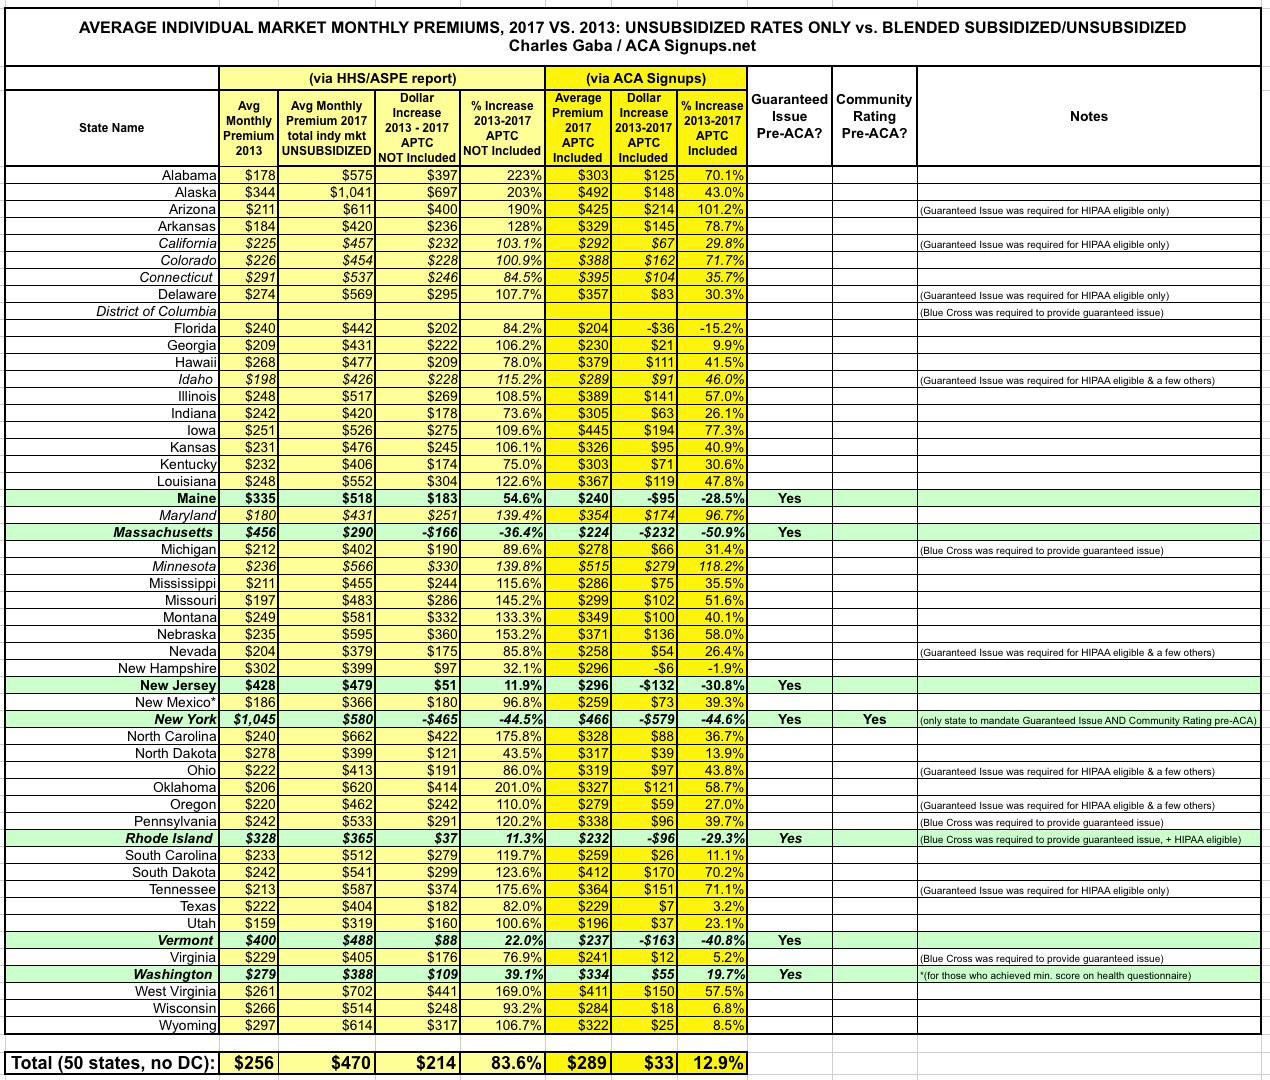
I should also note that plugging New York into the mix also has a significant impact on the national numbers as well. I didn't think it would move the needle that much, since NY's 243K only makes up about 2% of total exchange enrollment, but the fact that average premiums were so high in NY in 2013 and then plummeted so low (relatively speaking) before moving back up again means that the overall impact on the national scene is more pronounced than I would've expected:

Instead of a 95% unsubsidized average 4-year rate hike, it turns out it was only about 84%. Why? Because the average 2013 premium has been bumped up from $240 to $256 while the average 2017 premium only moved up by $3. This drops the average dollar increase (again, at full price) from $227 to $214, and the percentage increase from 95% to 84%.
Meanwhile, the average increase including subsidies drops further yet, from around 20% to just 13% nationally, a dramatic reduction caused by New York's stunning 45% drop from the states' 2013 high of $1,045 per person per month.
How to support my healthcare wonkery:
1. Donate via ActBlue or PayPal
2. Subscribe via Substack.
3. Subscribe via Patreon.


