ASPE's "105% Increase" Report even more misleading than I thought...and raises another important point
Last week Donald Trump's new Assistant Secretary for Planning & Evaluation, Stephen Parente (an avowed and open opponent of Obamacare) issued a hit piece on the ACA just one day ahead of the Congressional Budget Office's devastating report on the GOP's AHCA "replacement" healthcare plan.
The ASPE report made a simple claim: That average individual market premiums have more than doubled since ACA-compliant policies were launched in 2014. It plugged in the average individual market premiums for this year and compared them against the average indy market premiums for 2013 (the last year before all newly-enrolled policies had to be ACA compliant). It only included the 39 states maintained by the federal exchange, HealthCare.Gov, and concluded that on average, monthly premiums had increased from $224 in 2013 to $476 in 2017...a 105% increase over 4 years.
As I noted at the time, while this was likely to be fairly accurate when taken out of context, it didn't mean nearly as much as it appeared because:
- Premiums are almost always going to go up somewhat on average due to simple inflation, an aging population, rising drug prices etc. if nothing else (that is, even assuming 4% per year on average, rates would have still gone up at least 17% over 4 years absent any other factors); but more importantly...
- It's nearly impossible to compare apples to apples since pre-ACA policies were often "mini-meds" or "junk plans" which barely covered anything...and even the "full" major medical policies often didn't cover mental health, maternity/prenatal care and so forth; and finally...
- That "105% average increase" didn't include ACA tax credits, which apply to roughly 50% of the individual market. Seeing how tax credits to help pay for premiums is a core tenet of the ACA (one of the legs of the 3-legged stool) as well as in the GOP's own replacement bill, it's absurd to measure the "average premium cost" without taking those credits into account.
The following day, I decided to tackle this third point, running a full analysis of the average APTC assistance provided to individual market enrollees in all 39 states covered by the ASPE report. Lo and behold, I confirmed that when you include APTC assistance in the 2017 premiums for half the individual market, instead of them jumping by 105%, they've actually only gone up around 22%:
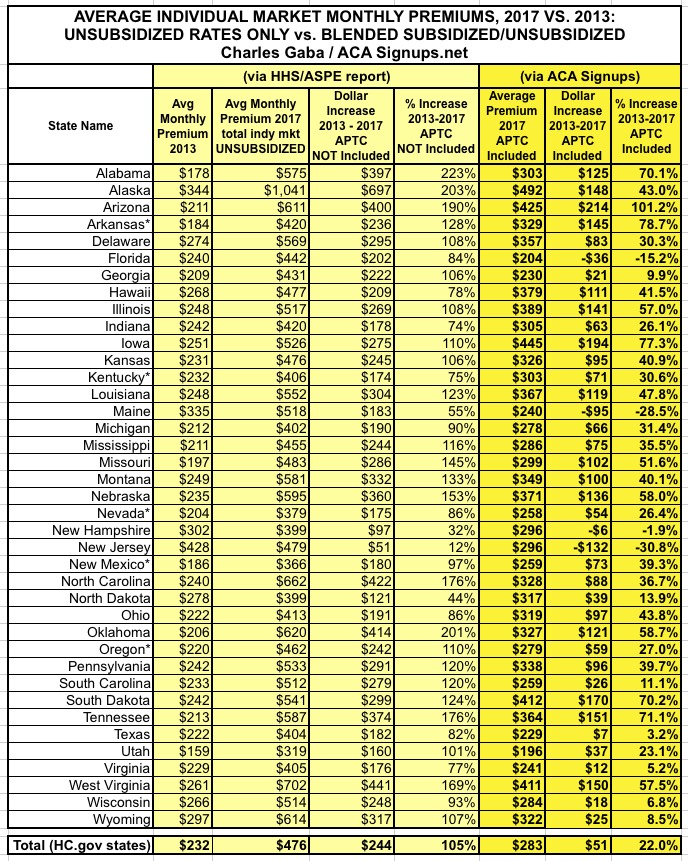
Now, it's important to note that since only half of individual market enrollees receive APTC, this doesn't do anything to make the other half feel any better; that's around 9 million people who are paying the full 105% average rate hike. However, this still does provide a more accurate picture of the situation.
However, there was one other thing which caught my eye: Notice that even before adding APTC into the mix, New Jersey only saw an average rate hike of 12%! Again, that's 4 years later...as noted above, simple inflation should've bumped NJ rates up by more than that! So what's going on in the Garden State?
Well, the most obvious anser is that New Jersey was one of a handful of states which already had Guaranteed Issue laws in place before the ACA regulations went into effect anyway. In fact, as you can see in the first column above, according to the ASPE report itself, New Jersey had the most expensive average individual market premiums of the 39 states included in the report.
Why? Because NJ carriers had to cover people with cancer, diabetes and so forth before the ACA required every state to do so...which meant much of the extra cost of doing so had already been baked into their prices to begin with....making the increase since then far less dramatic.
When you then add APTC assistance into the equation, of course, New Jersey indy market enrollees have actually seen, on average, a 31% drop in premiums (again, only half the enrollees actually receive subsidies).
OK, that's New Jersey. What about the other states which had Guaranteed Issue laws prior to the ACA? Well, it turns out that as of 2012, there were a total of 7 states which had full (or near-full) Guaranteed Issue policies in place:
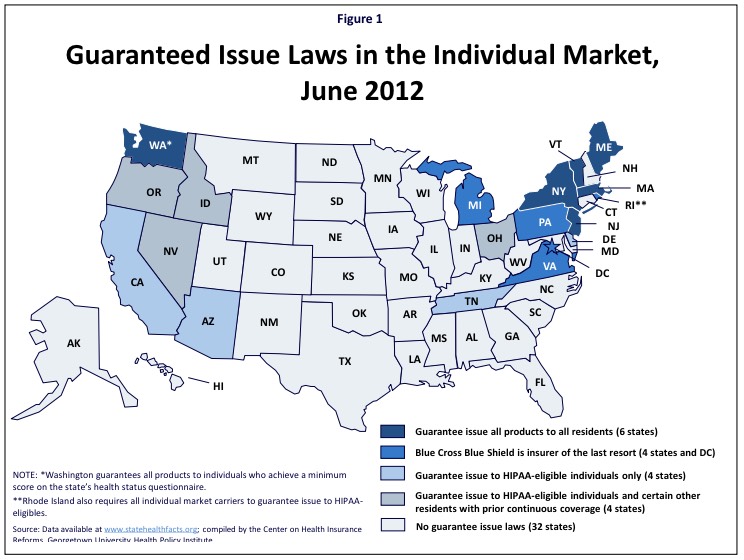
This is from the Kaiser Family Foundation, which goes on to explain that as of 2012:
- In five states (Maine, Massachusetts, New Jersey, New York, and Vermont), individual market insurers are required to guarantee issue all products to all residents. A sixth state, Washington, requires guaranteed issue to individuals who achieve a minimum score on the state's health status questionnaire.
- In five other states (DC, Michigan, Pennsylvania, Rhode Island and Virginia), a Blue Cross Blue Shield carrier has been designated as the issuer of last resort, meaning it will issue coverage to all who apply, regardless of their health status.
There's a footnote which states "*Rhode Island also requires all individual market carriers to guarantee issue to HIPAA eligibles." This, combined with the Blue Cross "issue of last resort" policy, is why I'm including Rhode Island (along with Washington) in the "Guaranteed Issue" category.
- Five states (Arizona, California, Delaware, Rhode Island and Tennessee), require all individual market carriers to guarantee issue coverage to HIPAA-eligible individuals, but to no other residents.
- Four states (Idaho, Nevada, Ohio and Oregon) require insurers to guarantee issue coverage to HIPAA-eligible individuals as well as to certain other residents with prior continuous coverage.
- Many states that don't require guaranteed issue plans in the individual market have high-risk pools that will cover people turned down by private insurers. Also, under the ACA, all states have a Pre-existing Condition Insurance Plan (PCIP) for individuals who have been denied coverage and been without health insurance for at least six months.
OK, so we know New Jersey has seen a relatively modest (full price) average rate hike. What about ME, MA, NY, RI, VT and WA?
Well, Maine comes in at 55%...not as low as NJ, but only half the average across all 39 states.
Massachusetts, New York, Rhode Island, Vermont and Washington State aren't listed in the ASPE report at all, because they each operate their own ACA exchange. Fortunately, I was able to dig up the 2013 data for 4 of them in another Kaiser Family Foundation analysis...and the 2017 data for these 4 states from the official CMS 2017 Open Enrollment Report, which includes partial data for all 50 states + DC. Washington State's data comes directly from the state exchange 2017 enrollment report.
Oh, yeah...and while I was at it, I was also able to fill in the missing data for Colorado, Connecticut, Idaho, Maryland and Minnesota! None of these were on the Guaranteed Issue list, but adding them still helps paint a more comprehensive national picture.
Unfortunately, I still haven't dug up the 2017 average premiums for California, DC or New York yet (although I have more on New York below).
OK, so what happens when I plug in the 9 more states, 4 of which already required carriers to cover pre-existing conditions for everyone (or nearly everyone)? This:
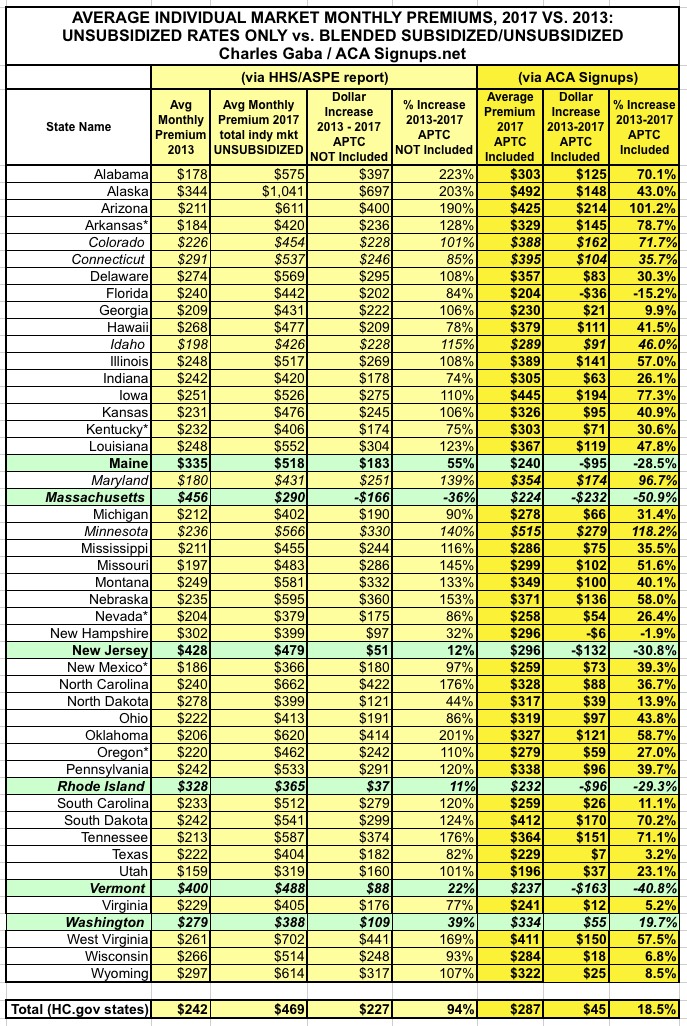
First thing to note: Nationally, the unsubsidized average rate increase has fallen from 105% (+$244) to 94% (+$227). Still nearly twice as high of course, but 11% lower is still 11% lower.
Secondly, the total average increase (including APTC assistance) has fallen from 22% to just 18.5%.
Finally, and most significantly: The green states are the ones which had full/near-full Guaranteed Issue policies in place as of 2013. Average full-price premium increases 4 years later?
- Maine: 55%
- Massachusetts: -36% (yes, you read that correctly...I think)
- New Jersey: 12%
- Rhode Island: 11%
- Vermont: 22%
- Washington State: 39%
Add them all up, and the average, unsubsidized rate hike for these 6 states has only gone up...3.6%. In 4 years. (I also removed Massachusetts just in case there's something glaringly wrong going on there, which brings the average up to 24.4%).
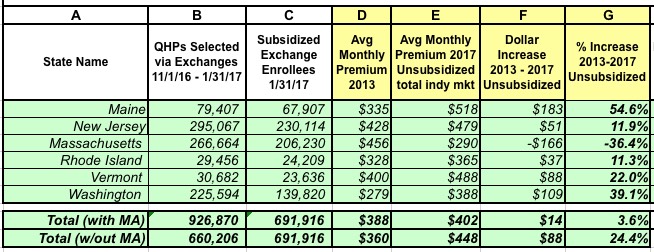
In short, once you adjust for the guaranteed issue factor, the "rate hike" talking point looks very different indeed.
But wait, there's more!
I mentioned that I'm still missing data for California, DC and New York...and NY is the final state which mandated Guaranteed Issue prior to the ACA.
Well, guess what? Check out this article from July 2013:
Health Plan Cost for New Yorkers Set to Fall 50%
Individuals buying health insurance on their own will see their premiums tumble next year in New York State as changes under the federal health care law take effect, Gov. Andrew M. Cuomo announced on Wednesday.
State insurance regulators say they have approved rates for 2014 that are at least 50 percent lower on average than those currently available in New York. Beginning in October, individuals in New York City who now pay $1,000 a month or more for coverage will be able to shop for health insurance for as little as $308 monthly. With federal subsidies, the cost will be even lower.
The article is too vague to allow me to plug the numbers into the actual spreadsheet, but according to the KFF data, the average monthly premium in New York stood at $429/month in 2013. If we take "at least 50% lower on average", that means perhaps $215/month for 2014.
NY then raised rates by an average of 13% in 2015, 7.1% in 2016 and 16.6% this year. That should make their 2017 average around $304/month today...or still 29% lower than they were in 2013. And again, this is for unsubsidized premiums. There's still too much fuzziness here for me to feel comfortable plugging it into the spreadsheet, but this still underscores the larger point: You simply cannot properly compare two insurance premium numbers when one of them prevents carriers from cherry-picking/discriminating and the other one doesn't.
UPDATE: Thanks to Louise Norris for pointing out this press release from the NY State Dept. of Financial Services:
Over 350,000 New Yorkers are enrolled in an individual plan. DFS reduced insurers’ total weighted average increase requested for individuals from 19.3 percent to 16.6 percent. Rates for individuals are more than 55 percent lower than prior to the establishment of the NY State of Health in 2014, adjusting for inflation but not counting federal financial assistance that is available to many consumers purchasing insurance. Financial assistance through federal tax credits for those who qualify will also increase in 2017.
Wow. According to this inflation calculator, inflation from 2013 - 2017 totalled just 5%. If I'm understanding this correctly, average rates in NY are still only around half of what they were in 2013.
UPDATE: OK, I realize I'm getting a bit obsessive here, but a contact of mine at CoveredCA has provided me with the critical data needed to fill in California:
- Unsubsidized Enrollees: $547/month per policyholder in 2016; around ~1.5 enrollees per policy, so roughly $362 per month per enrollee
- Subsidized Enrollees: $621/month per policyholder in 2016; around ~1.5 enrollees per policy, so roughly $411 per month per enrollee
- California announced average CoveredCA rate hikes of 13.2% for 2017. I don't know what the effective average rates are this year due to people dropping out, switching policies, changing metal levels and so on, but assuming the rates and accompanying APTC assistance also went up 13% on average, that would bring the 2017 averages up to: $409 (unsubsidized) and $464 (subsidized).
- Roughly 86% of CoveredCA enrollees are subsidized, so that's: (0.86 x $464) + (0.14 x $409) = $400 + $57 = $457/month on average per enrollee.
- I also know that the average subsidized CoveredCA enrollee received $299/month in APTC last year, which should translate to around $338 this year.
- With all that in mind, I was able to plug California into the master spreadsheet, resulting in the following tweaks (I also added blank lines for DC and New York for clarity):
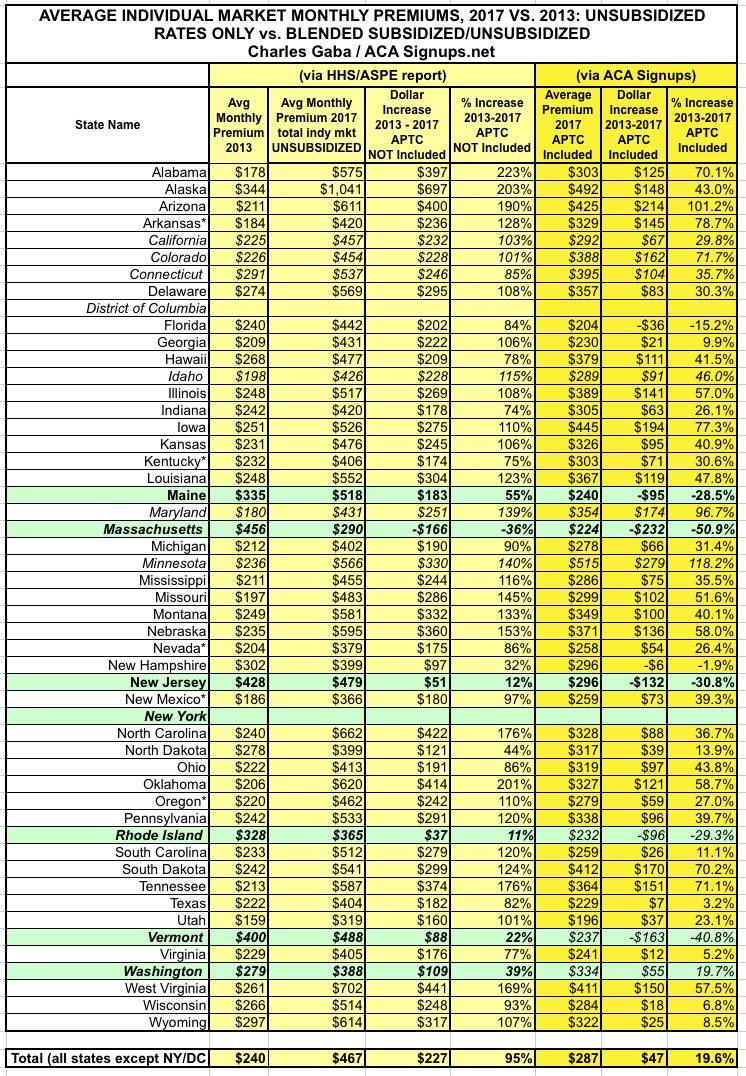
As you can see, even though California is huge (around 12% of the total market population), it doesn't really move the needle much because they're actually not far off from the national average (103% unsubsidized vs. 94% national; 30% w/APTC included vs. 18.5% natoinal). This bumped the national averages up just a bit, to 95% and 19.6% respectively.
Assuming New York's rates really are still considerably lower than they were in 2013, that should nudge the averages back down a smidge (DC's market is too small to even be a rounding error).
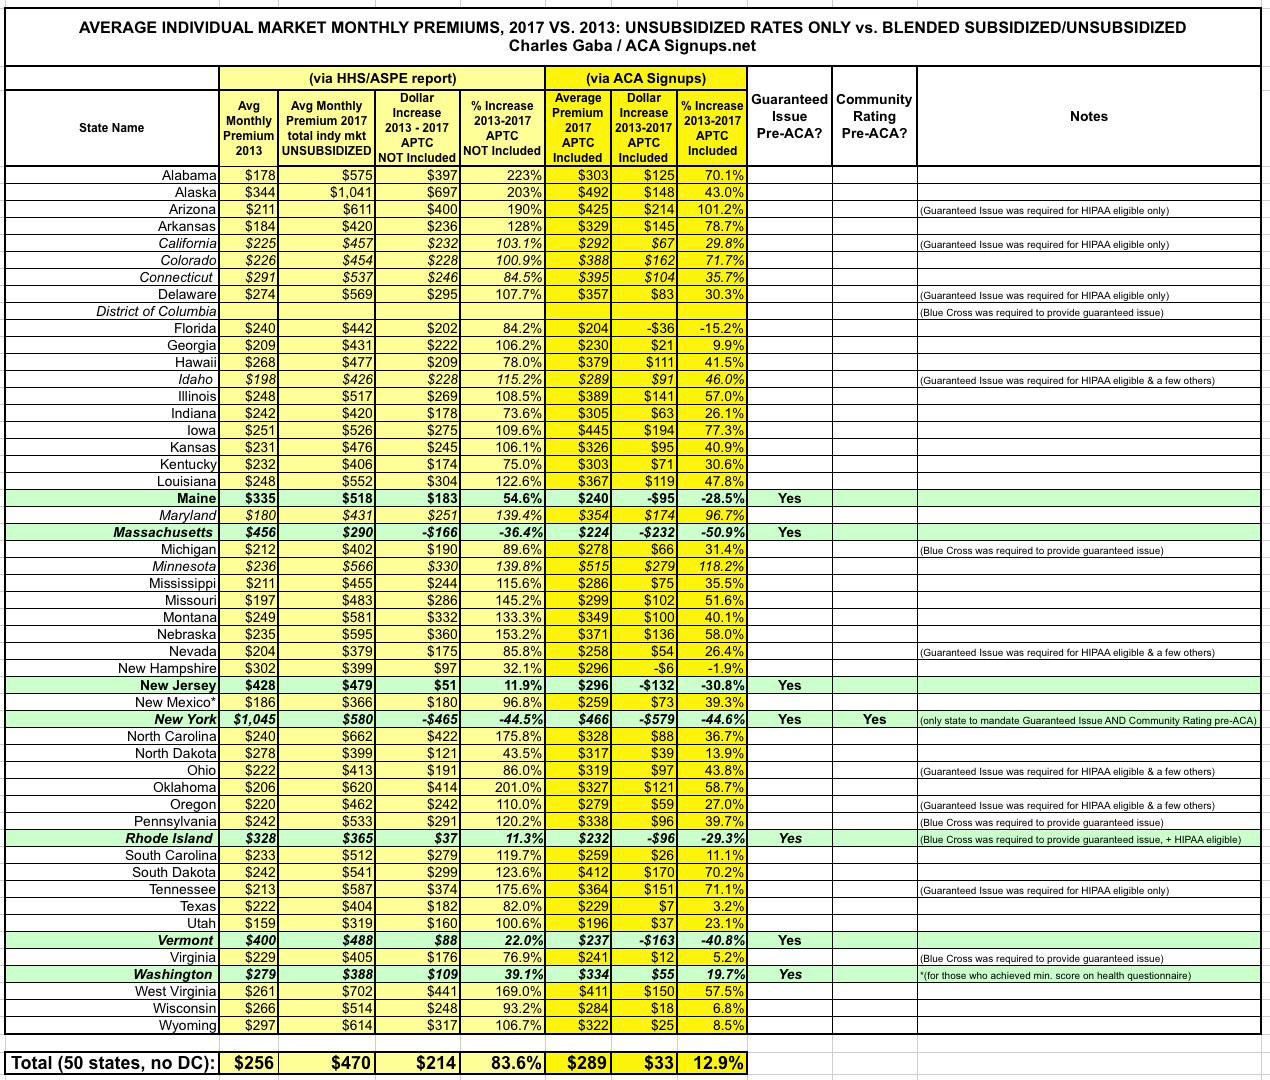
ONE MORE UPDATE: OK, I've finally plugged New York's numbers into the mix and they've knocked things down significantly: 84% unsubsidized average rate increase, just 13% when APTC is added in:
How to support my healthcare wonkery:
1. Donate via ActBlue or PayPal
2. Subscribe via Substack.
3. Subscribe via Patreon.


