

Connecticut: Datapalooza! OE5 Enrollment Data Breakout!
Fri, 02/02/2018 - 1:26pm
At this point, the only significant top-line 2018 Open Enrollment numbers missing are the final 10 days out of California (which could add perhaps 40,000 to the total) and a solid month of enrollment from the District of Columbia (23 days, actually, but they extended their deadline by 5 extra days, which may or may not be included in the final, official report from CMS). DC's tally through 1/08 was 21,352 QHP selections. Their all-time high was around 22,700 set in 2016, so I can't imagine that they added more than perhaps 2,000 more since 1/08. In other words, about 99.5% of the 2018 OEP QHP selections have likely been accounted for.
That means it's time to move on to...breaking down the demographic data! Woo-hoo! Parrrr-tyyyy!!
The big, official CMS report from the Assistant Secretary for Planning and Evaluation (ASPE) presumably won't be released for a couple of weeks, but some of the state-based exchanges are faster about posting their demographics. First up: Connecticut!
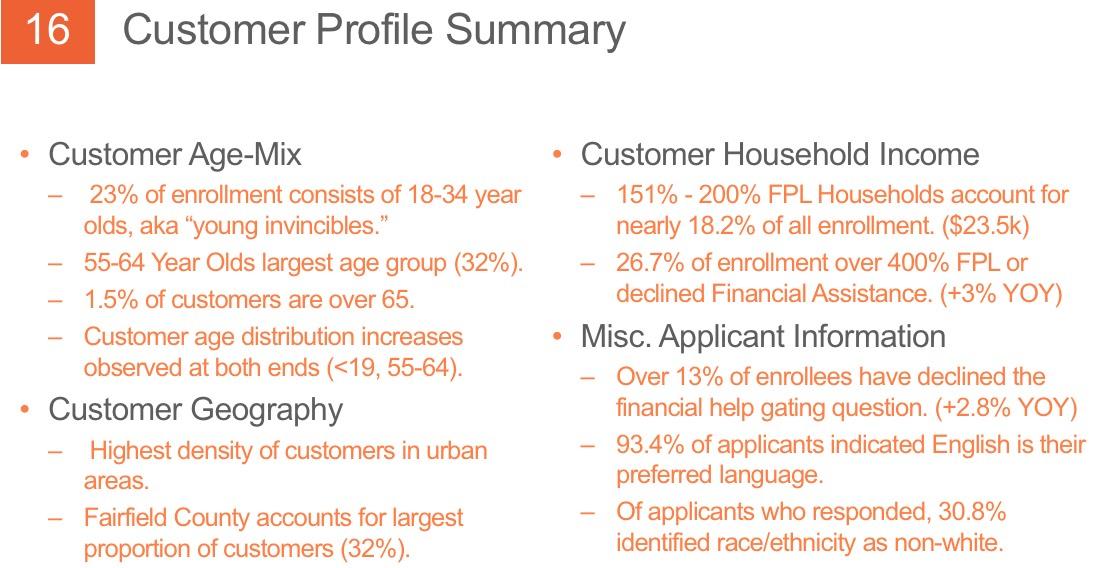
There's a ton of slides below, chock full of nerdy data nuggets. I'm not gonna comment on all fo them but will call out a few noteworthy items:
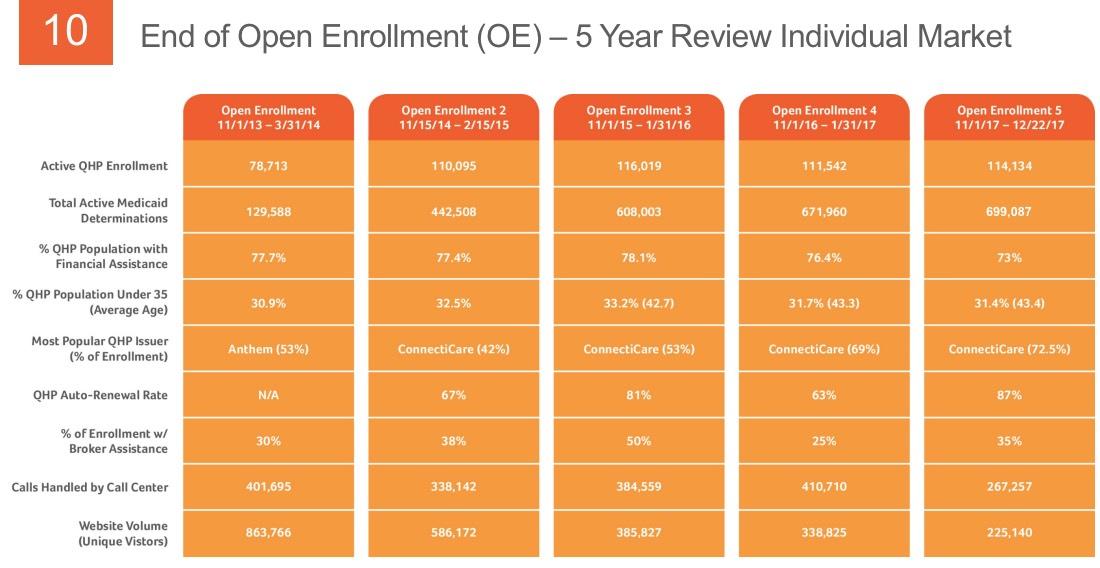
- Connecticut's total Medicaid enrollment has hovered between around 770,000 - 840,000 at any given time since ACA expansion launched in January 2014, so it looks like they've been gradually ramping up what percentage of enrollees are handled within the AccessHealthCT exchange itself. They're up to around 84% of it so far; it'll be nice if they're able to handle all Medicaid/CHIP enrollment through the exchange by the end of this year...much easier for tracking purposes.
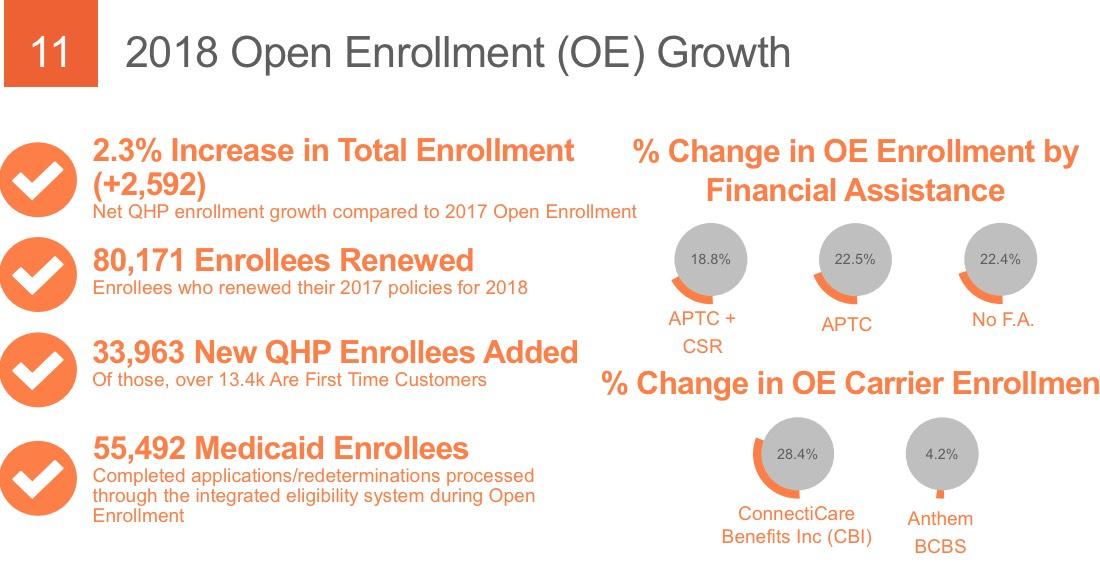
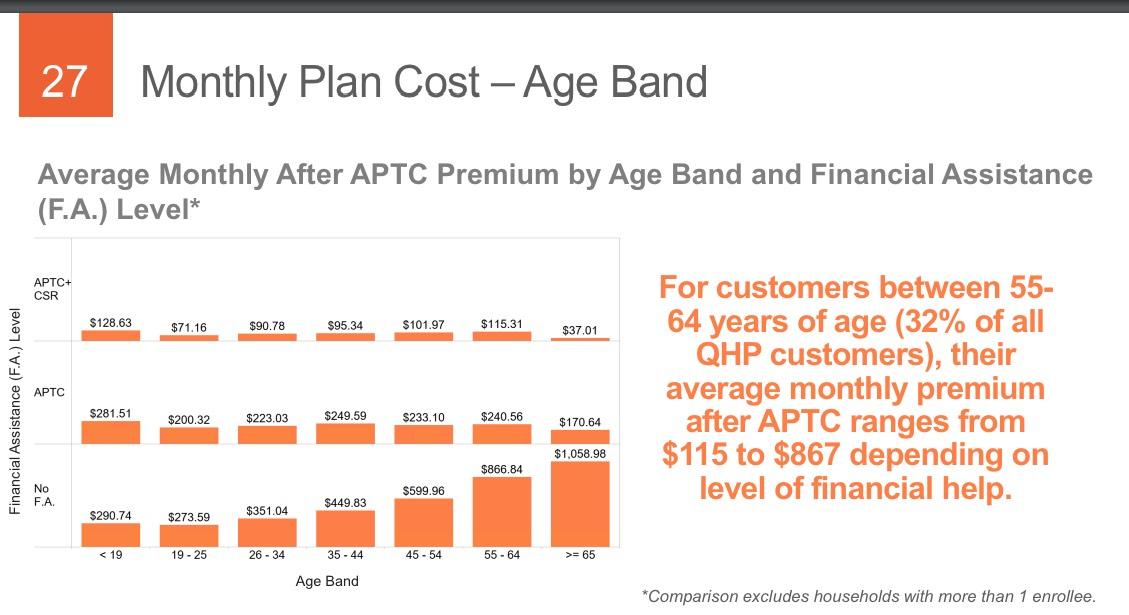
- The subsidized population has, surprisingly, dropped as a percentage of total enrollment, from around 78% the first 3 years and 76% last year to 73% this year. That amazes me considering that the unsubsidized, full-price premiums appear to have increased by a whopping 28% on average this year. It's even more surprising because total enrollment increased by 2,600 people this year...that means the raw number of unsubsidized enrollees increased from around 26,324 to 30,816, or about 4,500 people. Huh.
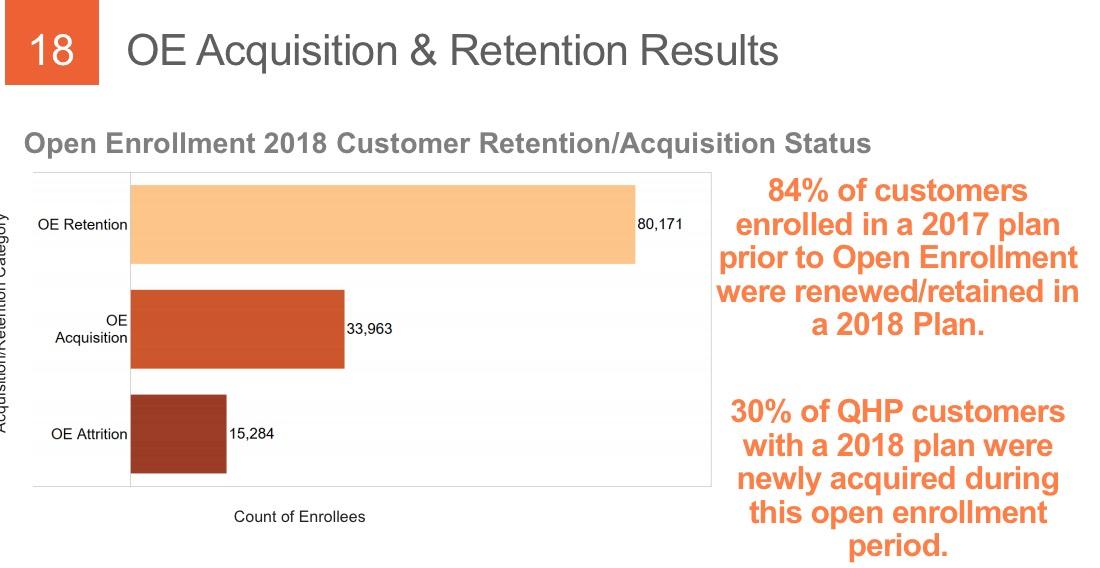
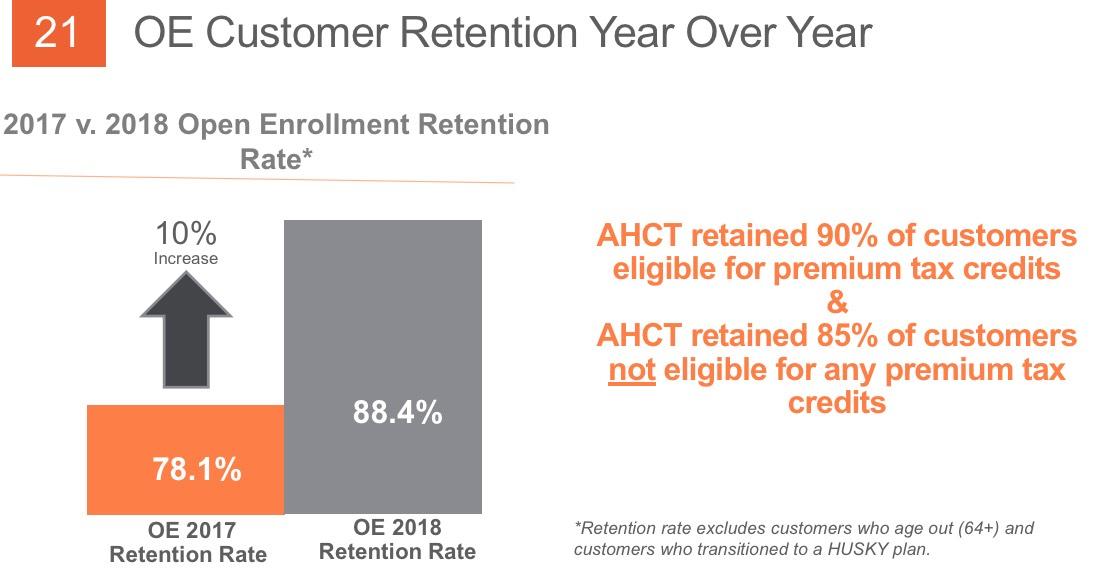
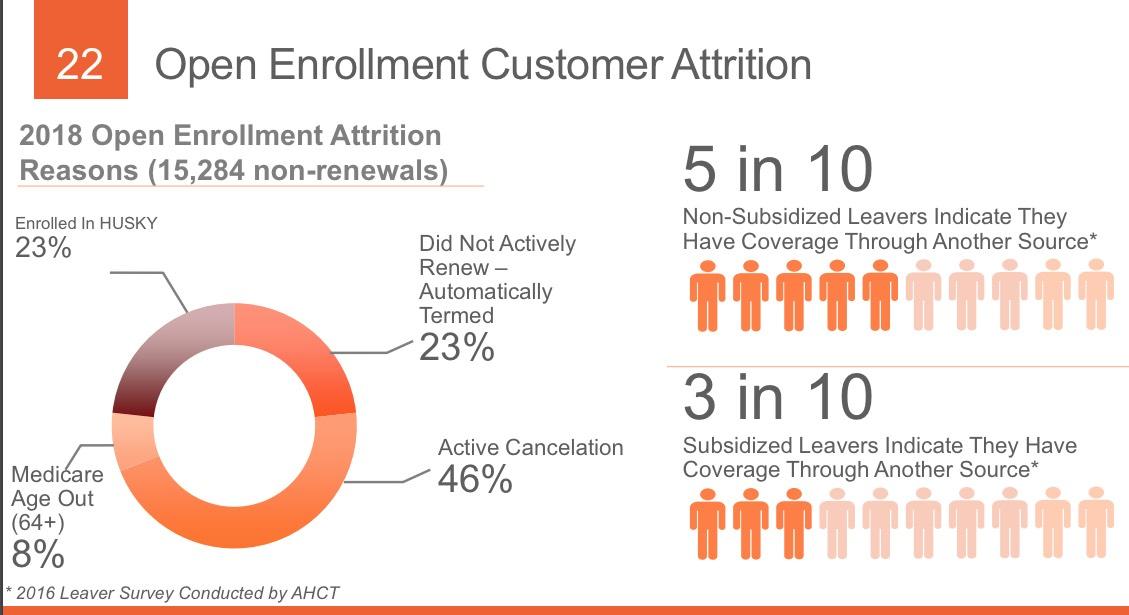
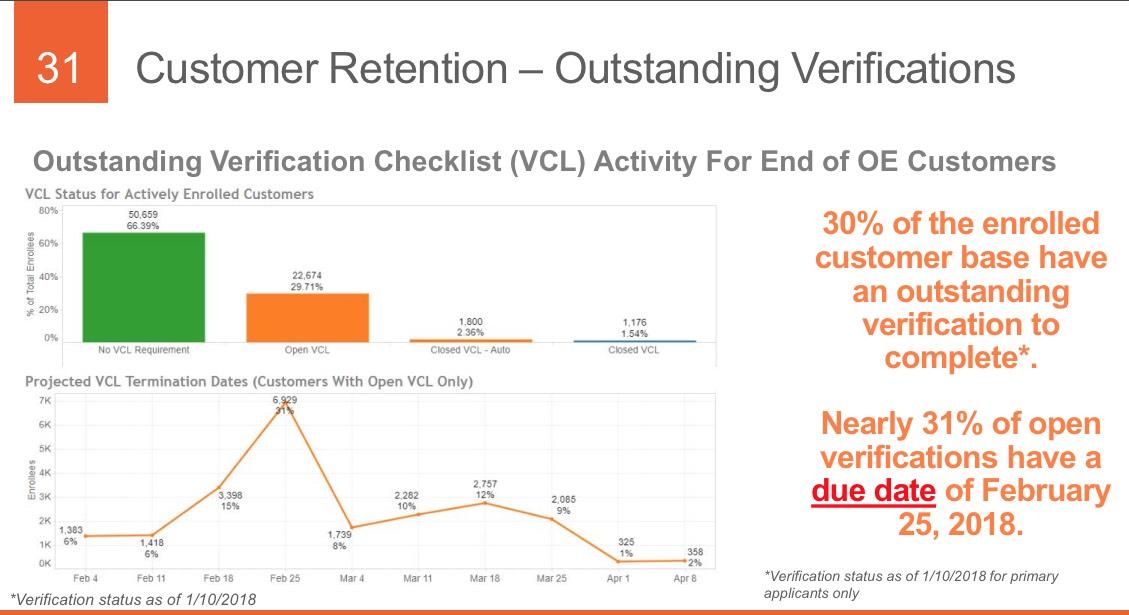
THIS is extremely useful info...I'd love to have this kind of granular data about not only how many people drop coverage over the course of the year but why they do so. As shown above, about 31% of those who drop their coverage only do so because they turned 65 and moved onto Medicare or their income/other status changed to the point that they qualified for Medicaid instead. That's important context when considering the non-renewal rate.
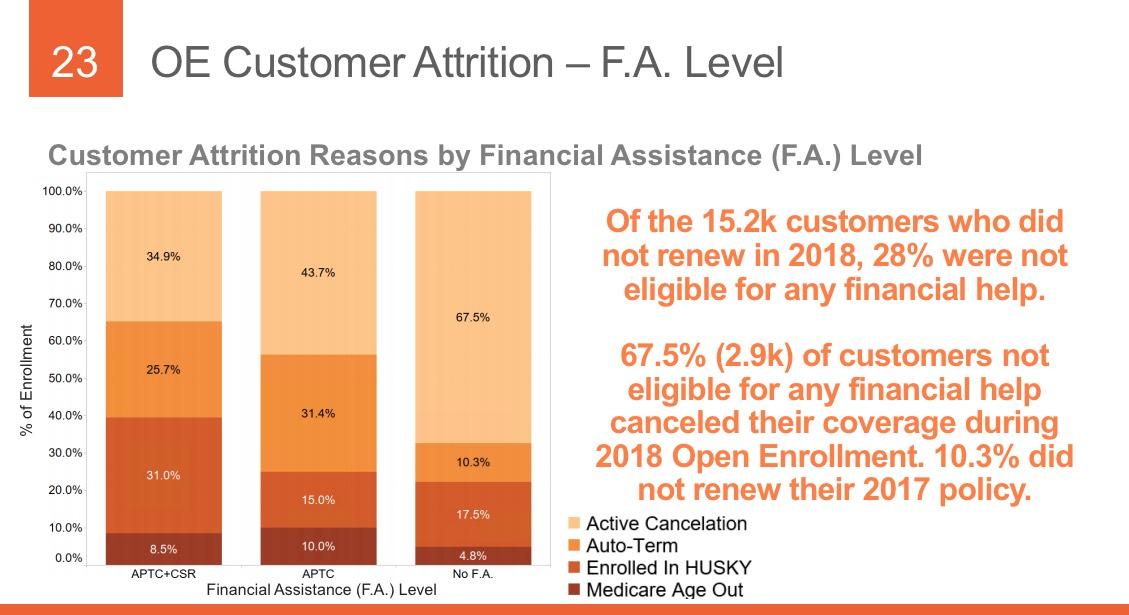
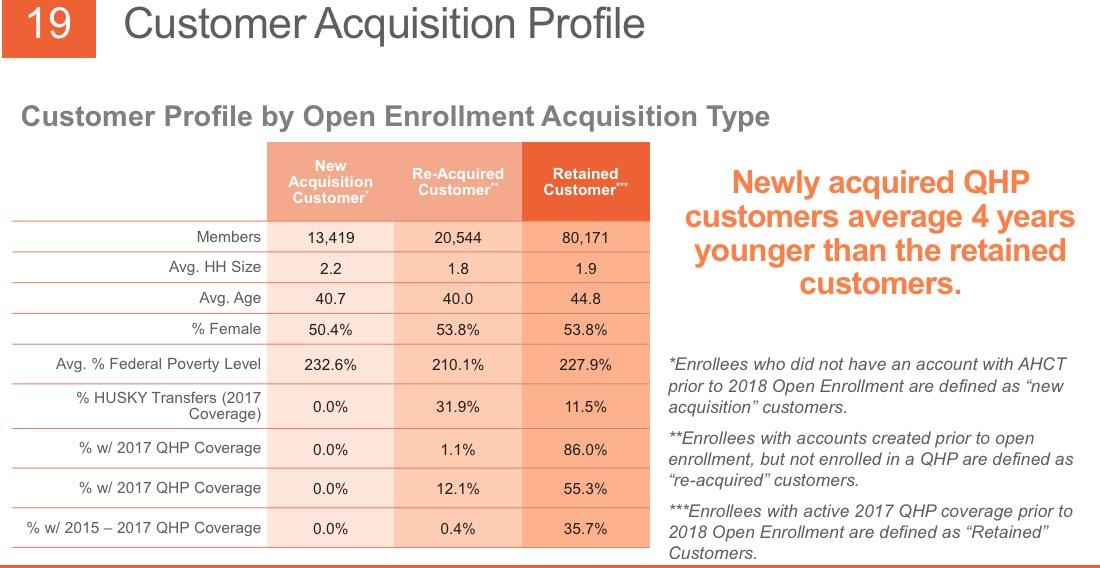
THIS likely explains the mystery of the unsubsidized numbers actually increasing year over year: Yes, unsubsidized rates jumped dramatically (especially for Silver plans), but instead of dropping coverage altogether, most enrollees presumably downgraded to Bronze. Not ideal but at least it keeps them in the risk pool.
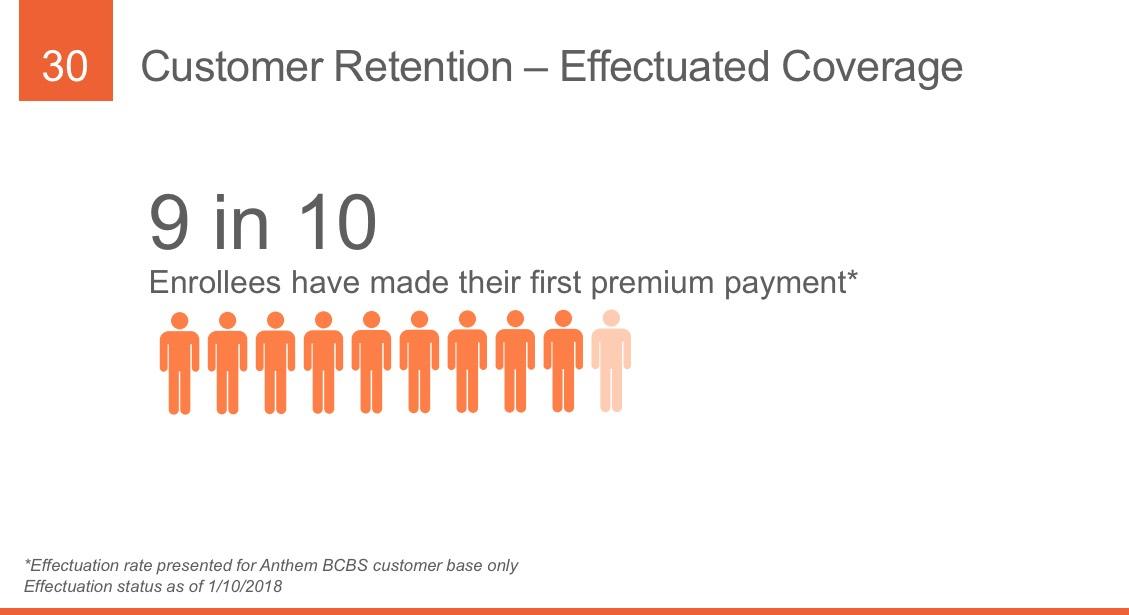
Oh, good...I see my "90% pay their first premium" rule of thumb is once again vindicated.
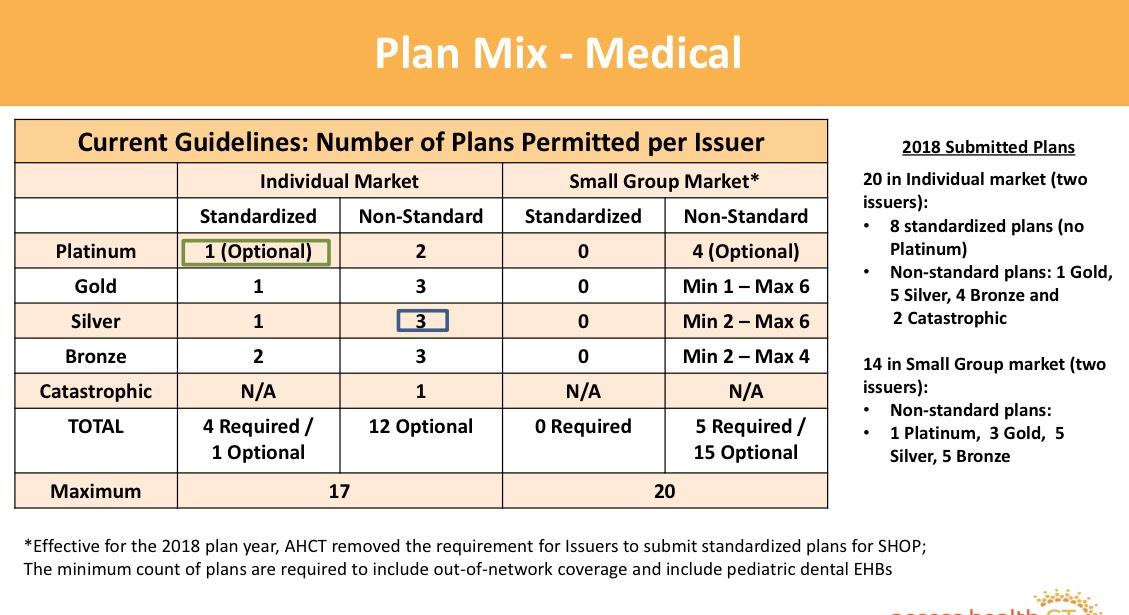
Access Health CT also gave a preview of their rules for 2019 exchange policies...looks like some minor tweeks are in store. I think it's great that they're limiting the number of plans for each carrier (it gets way too confusing otherwise, as well as allowing for what Dave Anderson calls "silver spamming"), but I'd love it if they went one step further and required only standard plans...
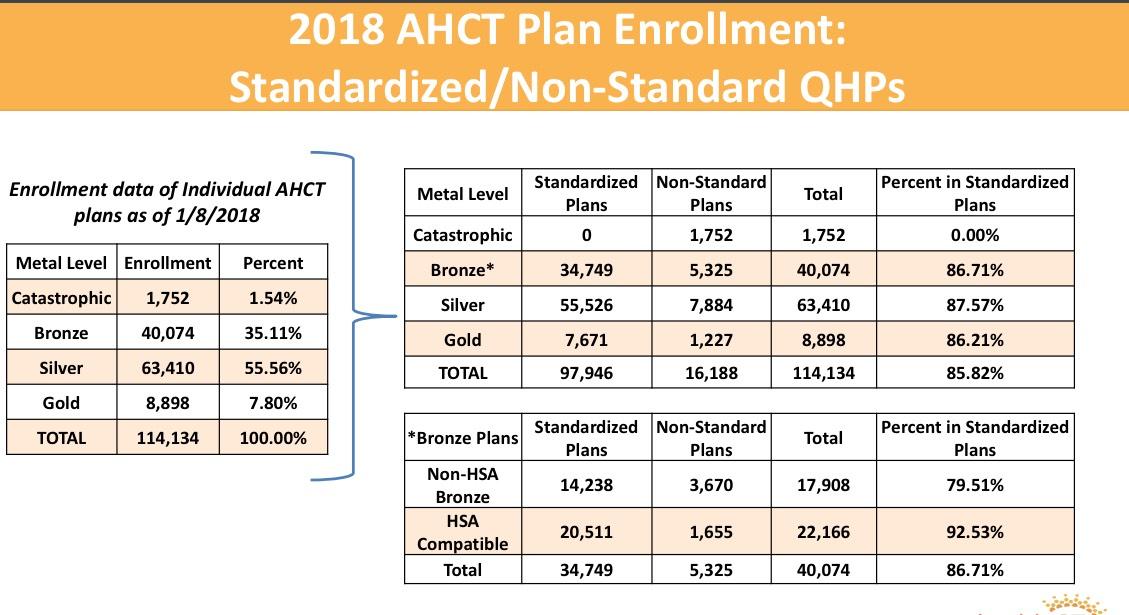
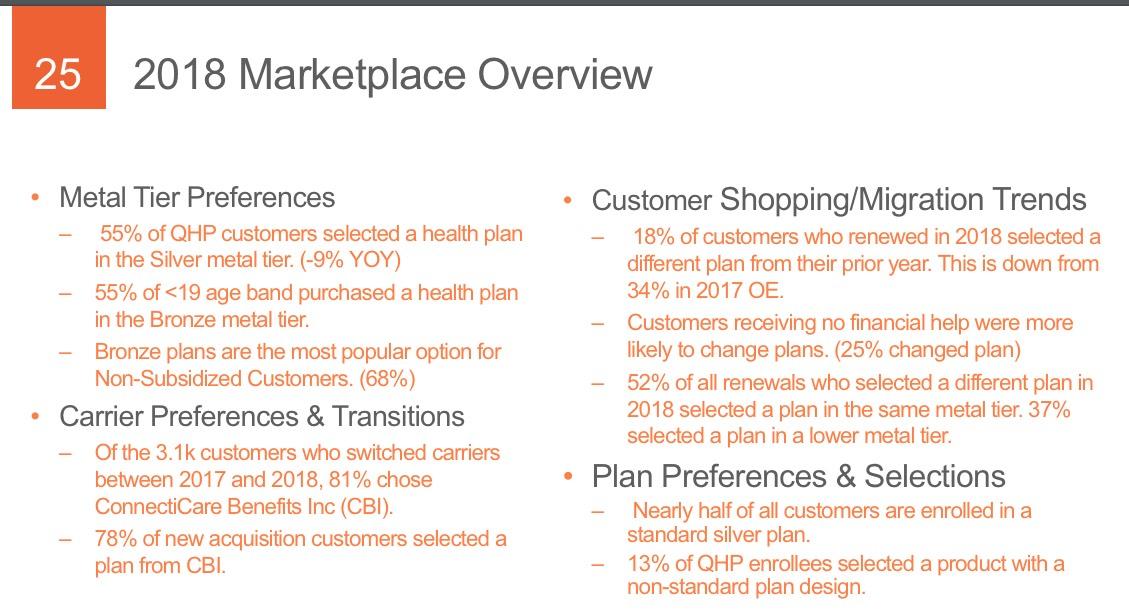
And finally, this is one of the most important data points I've been looking for: Metal levels. According to our CSR Silver Load spreadsheet, Connecticut is a full "Silver Switcharoo" state, so in theory there should be a significant shift away from Silver towards either Bronze, Gold or both this year. Let's compare:
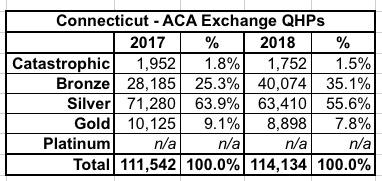
Yup, sure enough, Bronze plans leapt from 25% to 35%...although Gold plans actually dropped by about 1.3%. Apparently "dirt cheap Bronze" beats out "better value Gold" for most Connecticut enrollees.
Advertisement
