

My official OE4 State by State Projections
Sat, 11/26/2016 - 12:58pm
Last year I took a shot at predicting not only total Open Enrollment QHP selections nationally, but also on a state-by-state basis. Seeing how I ended up overestimating by a whopping 2 million people nationally (projection: 14.7 million; actual: 12.7 million...about a 16% difference), it shouldn't be surprising that I was also way off on most of the individual states.
Of the 50 states +DC, I was within +/- 5% in only 13 states. 6 states overperformed my projections by more than 5 points (MA, UT, MD, SD, MN and TN)...but 32 states underperformed by more than 5 points, and 17 states came in more than 15% lower than I was expecting. Ouch.
I was therefore understandably hesitant to put my neck out there again this year...and after the unexpected results of the Presidential election, all bets seemed to be off. However, seeing how the first couple of weeks of OE4 seem to be holding pretty closely to my national projections so far, I've decided to go ahead and post my state-level calls after all.
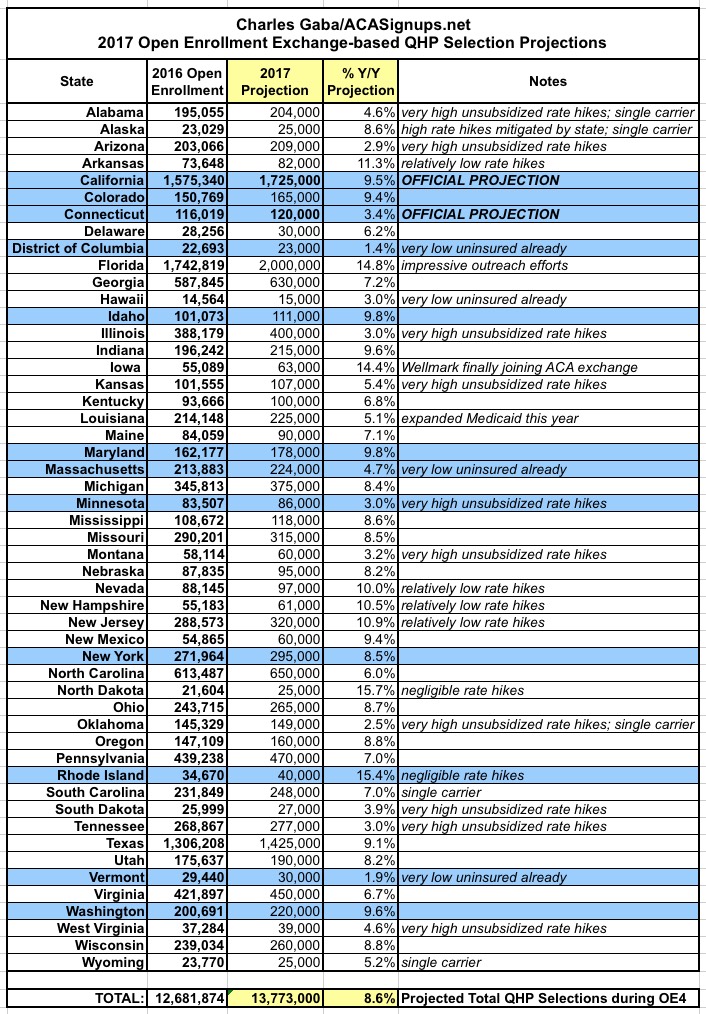
There's no great trick to my methodology. My national projection (13.5 - 14.0 million) lines up almost perfectly with the HHS Dept. this year (13.8 million), so that's where I started...assuming a national QHP selection bump of around 8.7% over last year (13.8 million vs. 12.7 million). I tacked 8.7% onto each state's OE3 total to get a baseline projection.
After that, I bumped my estimate for each state up or down depending on a variety of factors, including:
- Is there an official (or semi-official) QHP projection for that state from their ACA exchange?
(Only 2 states, CA & CO, have issued formal projections to my knowledge) - How ugly are their average unsubsidized rate hikes expected to be?
- How many carriers are participating in the exchange in 2017?
- How high/low is the uninsured rate in that state to begin with?
- Did they expand Medicaid this year?
(Last year both Pennsylvania and Indiana were impacted by this, but this year Louisiana is the only state which has done so) - Other oddball factors and educated guesswork on my part.
With all of these taken into account, here's what I've come up with. I obviously could end up being way off on any number of these, but at least it gives me something to base the progress of the enrollment period on:
As of midnight tonight (Saturday, Nov. 26th), I estimate there should be a grand total of roughly 2.69 million QHP selections nationally, or 19.5% of the eventual total, with 2.07 million of those being run through the federal exchange (HC.gov).
While CMS has announced 1,008,218 enrollees via HC.gov as of 11/12/16 (9.5% of my eventual HC.gov projection), they didn't break that out by state, and of course an additional 2 weeks has passed since then.
For the state-based exchanges, I only have hard numbers from five of them:
- California: 308,347 as of 11/15 (17.9% of target; running ahead of my expectations as of that date)
- Colorado: 26,400 as of 11/22 (16.0% of target; running about even with my expectations as of that date)
- Connecticut: 16,498 as of 11/17 (13.8% of target; running about even with my expectations as of that date)
- Massachusetts: 23,026 as of 11/17 (10.3% of target; running behind my expectations as of that date)
- Minnesota: 28,475 as of 11/20 (33.1% of target; running well ahead of my expectations as of that date, mainly due to their unique enrollment cap policy)
However, without the state breakout of the 39 states on HC.gov, I can't really see any larger trends as of yet. They should be releasing a Snapshot Report for Weeks 3 & 4 sometime this week, hopefully with a state breakout which will let me see how things are shaping up so far.
Advertisement
