

UPDATED: STATE BY STATE: How every state* did this year vs. 2015, vs. projections & vs. total eligible!
Thu, 02/04/2016 - 5:24pm
*(with 5 exceptions; see below)
The final numbers (through either 1/31, 2/01 or 2/02 depending on the state) are now in for 44 states plus DC. There are still 6 states which are missing some enrollment data:
- Idaho: 5 days missing
- New York: 8 days missing
- Vermont: 36 days missing
UPDATE 2/5/16: Kentucky just released their numbers.
UPDATE 2/8/16: Connecticut has released their numbers.
UPDATE 2/11/16: Massachusetts has released their numbers.
Combined, the missing enrollment data from these states should add up to roughly 45,000 more QHP selections to bring the national total up to right around 12.7 million, although it could potentially be up to another 100,000, I suppose. I've plugged in the hard numbers as of today for every state, along with a 45K "unsorted" at the bottom. There are also some notes on the right side about known "purged" enrollments as well as the 430K BHP enrollments for both New York and Minnesota.
When you include the purges and BHPs, the grand total is actually over 13.4 million; without BHPs it's 13.0 million. I'll leave it up to you to decide whether either of these groups should "count" or not.
OK, since I've known for several weeks now that my original projection was likely to be way off this year, let's leave that for last. First up, how did each state do compared with 2015?
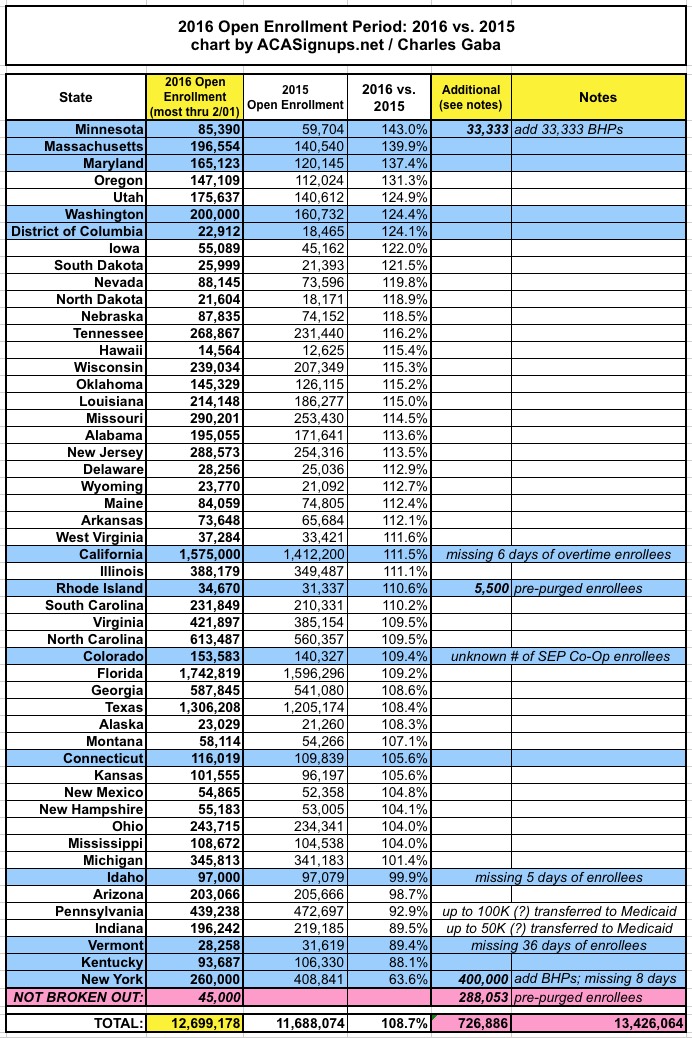
The three "M" exchanges (Minnesota, Maryland and Massachusetts) kicked some major ass this year, with each one enrolling more than 1/3 more people than 2015. Other strong performers (more than a 20% increase) were Oregon, Utah, Washington State, DC, Iowa and South Dakota, although Washington is a bit of a cheat since they actually did the reverse of HC.gov this year; they went from only counting paid enrollees to counting all selections. A true year/year comparison would likely be more like an 11% gain for WA.
Note that Maryland's number may go up a bit more since they still have 5 days' worth of "overtime" enrollees to tack on, though they've also informed me that they'll be doing some "pre-purging" themselves, so perhaps not.
At the opposite end, at least 3 states (and potentially up to 7) underperformed compared to 2015: Arizona, Pennsylvania and Indiana each enrolled fewer people in exchange policies than last year, although for PA and IN the main reason for this was a good 150K people being shifted over to Medicaid expansion (CMS confirmed this for Indiana on the conference call, and PA was only halfway done enrolling people in Medicaid expansion when OE3 started this year).
Idaho and Vermont may have underperformed, but all four of them are still missing some data, so it's impossible to know for sure yet. My guess is that they'll break 100% of last year in the end.
Kentucky...well, what can I say? Kentucky, which was the model for ACA performance for the first 2 years, ended up 12% lower than last year. Gee, I can't imagine why...
Finally, there's New York, which is a special case. Aside from missing a week's worth of enrollees, they're still likely to end up a good 30% behind 2015. However, most of this is due to the 160,000 people who moved from QHP coverage last year over to their new BHP (basic health plan) program....plus an additional 240,000 new folks who signed up for the BHP program as well.
Assuming all 160K had otherwise stayed on a QHP (which of course probably wouldn't have happened), New York would have had at least 420,000 QHP enrollees total...which is almost exactly what I had been expecting.
Finally, there's the 288K "pre-purged" enrollments. I have no idea how these were distributed between the states; assuming it was evenly spread, tack another 3% on top of all 38 HC.gov states to get their "real" plan selection number. That would put Arizona over the top, but PA and IN would still be a bit behind.
Next: How did each state do compared to the total pool of people who could legally enroll in the ACA exchanges?
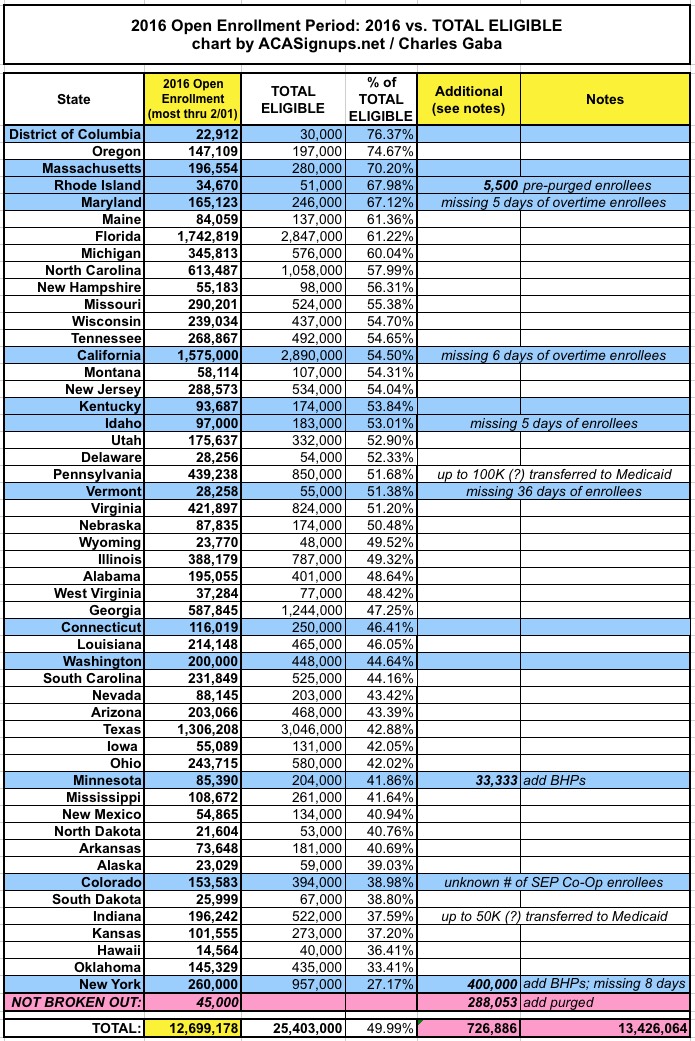
My numbers for this table are based primarily on a combination of the uninsured population estimated by the Kaiser Family Foundation's ACA Exchange Eligibility Report (15.8 million) plus all those who were already enrolled in ACA exchange policies as of last fall (about 9.6 million at the time). This is an imperfect estimate, of course; the 9/30/15 effectuation number was down to 9.3 million, for instance, and the 12/31/15 effectuated exchange number was likely down to around 8.9 million or so, but it's the best I could come up with given how much churn and overlap there is.
The biggest takeaway here is that the ACA exchanges did manage to enroll effectively 50% of the total number who are theoretically eligible to do so (whether subsidized or not), though this will likely drop to 40% assuming the HHS is correct about the end of year effectuation number dropping down to 10.0 million.
It's also important to once again note that New York is a special case; officially only 27% of those eligible to enroll in exchange QHPs did so...but another 18% did sign up for BHP coverage, so they actually "should" be up to around 45%, just behind Louisiana. Similarly, Minnesota "should" really be higher since including their BHP enrollees brings the total up to around 119K (58% of the total eligible).
Other than that, I don't see any particular patterns here; right-wing states like Oklahoma, Kansas and South Dakota are near the bottom...but so is Hawaii. Most of the best performing states are left-leaning...but Florida and Missouri are doing fine here as well.
Next up, let's look at how well the HHS Dept. did with their projections. This was tricky because HHS doesn't publicly state their state-level projections, just a national total. On the other hand, some state exchanges do post their own projections.
In order to come up the state-level breakdown, I used the official projections for the 7 states which stated them publicly (California, Colorado, Connecticut, Idaho, Maryland, Minnesota and Vermont).
For the other 43 states (plus DC), since HHS projected a midrange of 12.55 million (7.4% higher than the 11.689 million from last year), I simply tacked on roughly 7.4% to each state's 2015 number, give or take. Again, not ideal but the best I could come up with at the time. Here's how that worked out:
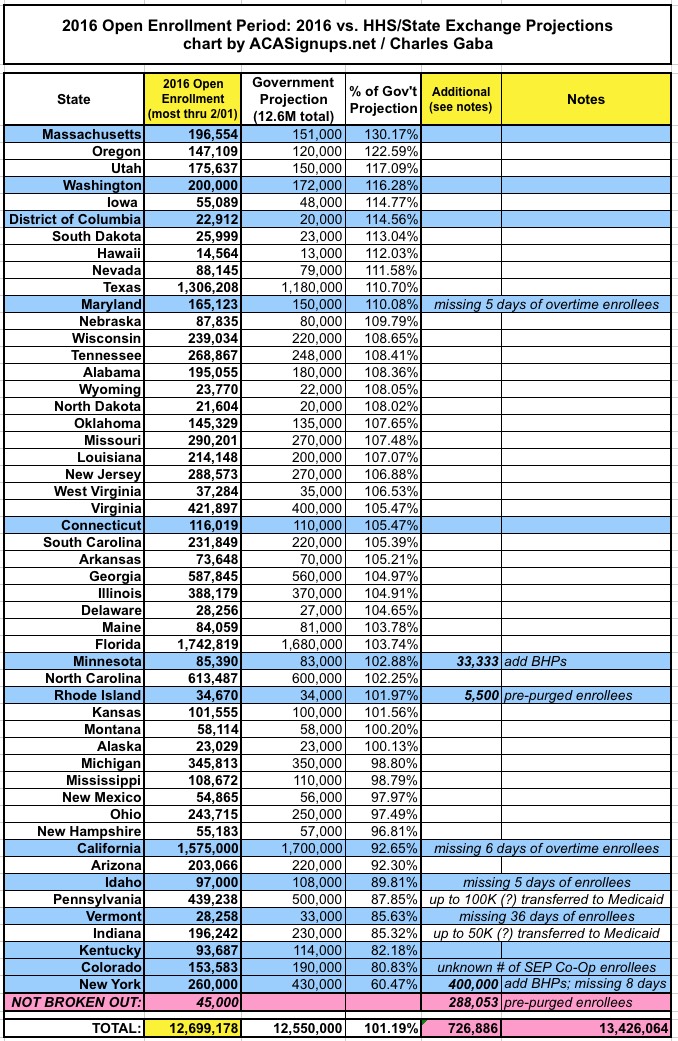
Again, without knowing exactly how many additional people selected plans in the missing states, I don't know precisely how accurate HHS was, but "about 12.7 million" should mean anywhere between 12.654.178 and 12,749,999. HHS came in anywhere between 0.8% and 1.6% ahead of their mid-range.
In 2014, the HHS Dept's official projection (according to Kathleen Sebelius) was "at least 7 million people signing up during open enrollment". The actual number turned out to be 8,019,763, meaning that they undershot by 12.7%.
Meanwhile, depending on which metric and point in time you were talking about, I was off anywhere between 0.02% - 2.75%.
In 2015, the HHS Dept's official projection was "between 9.0 - 9.9 million effectuated" which is hard to reverse-engineer into the number of policies selected.
As for myself, I was off by either 2.5% or 6.9%, depending on whether you went by my original projection (12.0 million) or my later revision (12.5 million).
This year my final projection was 12.65 million (the mid-range between 12.4 - 12.9 million)...in which case I was either dead-on target or, at worst, off by 0.8%.
However, a more honest assessment would be to use my original 14.7 million projection...in which case I dropped the ball by overestimating by a whopping 2 million, or 15.7%. Ouch; that's the worst projection I've made to date.
In other words, after 3 years, the HHS Department of the United States, with thousands of employees and hundreds of millions of dollars to work with, has finally gotten more accurate at figuring the enrollment numbers out than me. :)
Anyway, here's what my own ill-fated state-level projections turned out; I've also included the hard numbers to show just how close or far off I turned out to be for each state:
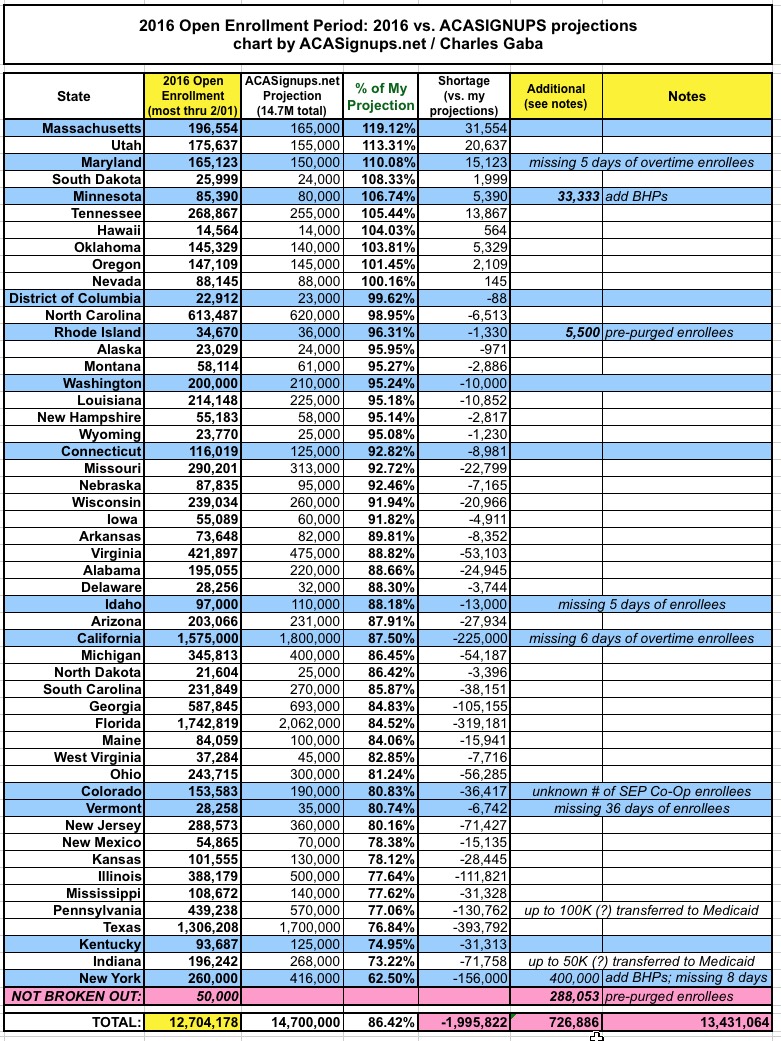
As you can see, 10 states ended up overperforming my expectations (11 if you included New York's successful launch of the BHP program, although that's a judgment call). However, those states only overperformed by around 100,000 collectively (or around 350K if you tack on NY's BHPs).
On the flip side, unfortunately, most of the other 40 states underperformed my projections to some degree...including huge numbers from several of the big ones: Illinois, California, Florida and Texas collectively underperformed by over a million people.
As I've noted a couple of times, in addition to the New York BHP factor, both Indiana and Pennsylvania launched Medicaid expansion last year, which shifted perhaps 150,000 people off of exchange QHPs over to Medicaid.
Again, there's still up to perhaps 45K in stray enrollees left to lock down, but that's about it.
Advertisement
