

Guess what? Several million OFF-exchange enrollees appear to qualify for exchange subsidies!!
Thu, 09/08/2016 - 12:30am
WARNING: This is a pretty long, wonky, number-crunchy post...if you want to skip to the point of it about 2/3 down, click here.
Yesterday I posted an extensive entry in which I reiterated, with a substantial amount of hard data (h/t to Bob Laszewski & Steve Davis) to back me up, that the off exchange individual health insurance market is consdierably larger than many pundits, reporters, politicians and policy wonks seem willing to admit; in fact, it appears to make up around 36% of the ACA-compliant indy market if you include grandfathered/transitional plans, or around 40% if you don't include them.
Laszewski is generally opposed to the ACA, so his main angle here is that he's grumpy about the HHS Dept. pushing the "85% of ACA indy enrollees are subsidized!" meme even though it's actually more like 50% when you include the off-exchange enrollees; in fact, he's posted another piece about exactly this over at Forbes today. I, of course, am supportive of the ACA, but made the exact same point just two weeks ago in my own rant about it.
HOWEVER, while Laszewski sees the high number of off exchange enrollees purely as a liability, I actually see it as an opportunity as well.
Before I get to that, we need to know just how many people are enrolled in off-exchange, ACA-compliant policies. The second half of my post yesterday included a big spreadsheet which included my best attempt to estimate that number; at the time, I figured it was roughly 7.3 million people nationally.
However, after looking at some new hard data out of Texas and taking a closer look at some existing data I have for Florida and a few other states, I'm knocking this down to around 7.1 million:
TEXAS:
An anonymous supporter pointed me towards this report from the Texas Association of Health Plans. As the writer noted:
Texas enrollment: 60% in Marketplace, 23% off-exchange but ACA compliant, 17% grandfathered/mothered. This distribution includes people holding onto old non-compliant plans, not just those buying after 2014.
The Texas Association of Health Plans has an ongoing survey of its member companies that tracks individual market enrollment (on vs off-exchange, PPO vs HMO, new vs grandfathered/grandmothered). Data captures carriers that cover 96% of the individual market. Share both on and off exchange (in compliant plans) increased from 2014 to 2015, as people dropped old, non compliant plans
Here's the relevant graphic:
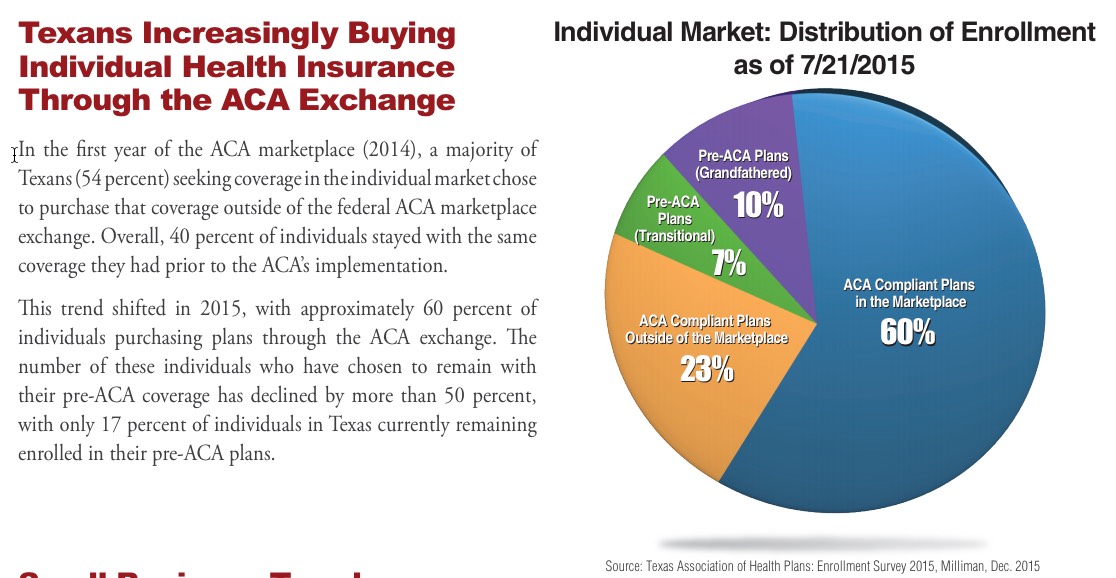
The study itself was done by the highly-respected Milliman actuarial firm, and are pretty rock-solid. The only caveat is that the data was as of 7/21/15...over a year ago. This means that both the grandfathered and transitional percentages have almost certainly dropped a point or two by now, as more people on "legacy" plans have continued to either die (hey, it happens), age into Medicare, move, get a job with group coverage and so on. I have the hard numbers for 2014 and 2015 from the Milliman report, along with some hard data for 2016. I know, for instance, that as of March 2016, there were exactly 1,092,650 people enrolled on the exchange, while Mark Farrah Associates says that there were 1,801,126 people enrolled in Texas's total individual market. The exchange-based proportion has remained almost identical (60.7%), so the off-exchange share must have shifted a bit. Here's my best guess at what that looks like this year:
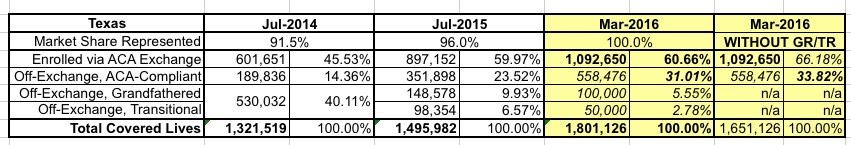
Since grandfathered and transitional numbers could only go down, and the exchange-based percentage is locked in, that leaves only one place for the shift to move to...ACA-compliant off-exchange enrollment, which I'm guessing stands at around 31% with GR/TR included, or around 34% without them. Eventually the GF/TR numbers should dwindle down to nothing at all, and after that I presume the exchange-based percentage will quietly increase every year, but in the meantime, these percentages are about 5-6 points lower than I had estimated nationally yesterday.
FLORIDA:
In Florida, meanwhile, here's what the numbers looked like a year and a half ago (March 2015); this comes straight from the FL Dept. of Insurance:
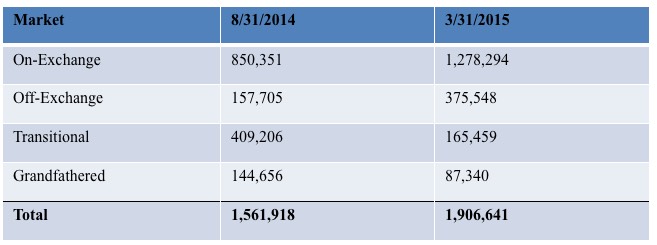
Here's what Florida looks like for 2014, 2015 and my best estimate for March 2016 using the data I have:
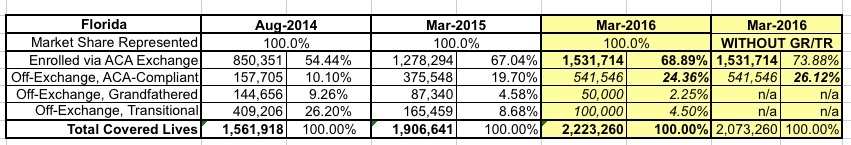
Again, the off-exchange data is lower than the national estimates I came up with yesterday: Around 24% with GF/TR, around 26% without them.
On the one hand, TX and FL combined makeup 20% of the entire individual market. The exchange-based enrollments make up 65% of the total individual market for these two states (2,624,364 / 4,024,386)...but nationally, exchange policies only make up 55% of the total individual market (and if you remove TX and FL, exchange enrollees in the remaining 48 states (plus DC) only make up 52% of the total).
The point is that the relative breakout is all over the map from state to state.
In IOWA, ACA-compliant off-exchange enrollees only make up around 17% of the total, with grandfathered plans eating up a whopping 46% of the total.
In South Dakota, exchange-based plans only make up 33% of the total, with GF/TR plans combined making up 43%, leaving just 23% for off-exchange ACA compliant.
In addition, the District of Columbia has no off-exchange ACA-compliant enrollments whatsoever (because all independent policies have been required to be sold via the DC exchange since 2014), nor did they allow transitional plans.
VERMONT doesn't have transitional plans either, and didn't allow off-exchange enrollments in 2014 or 2015...but changed that policy this year; about 4,000 people enrolled off-exchange.
In other words, across these 5 states (+DC), it looks like ACA-compliant off-exchange policies only add up to around 27% of the indy market, not the 36% I had previously estimated.
On the other hand, the Blue Cross data provided in yesterday's update was also pretty compelling; it only covers 23% of the total individual market, but encompasses 26 different states in doing so.
With all this conflicting data to deal with, I decided to plug in the 5 states + DC and then enter the hard numbers I do have for the other 45 states. For grandfathered and transitional enrollees, I assumed the same 6.57% grandfathered & 3.62% transitional percentages (even though a bunch of those states don't have transitional plans at all...bear with me) to see how it tallied up. Here's what I came up with:
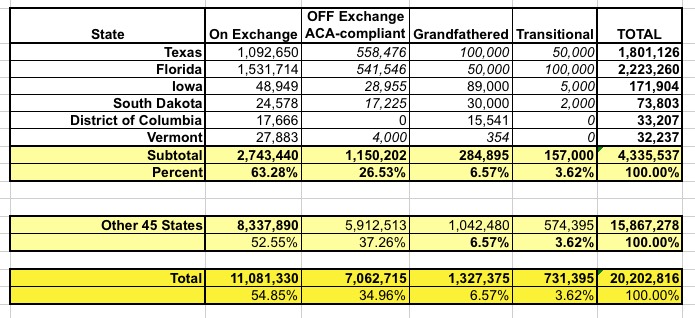
As you can see, about 200,000 people shift over to the GR/TR columns, leaving ACA-off exchange at 7.1 million. Not a huge shift after all of that.
The only problem with this is that I stll have around 225K people entered as "transitional plan" enrollees in states which don't allow them this year. These people are enrolled in off-exchange policies, but don't appear to be ACA-compliant, so I've added them to the Grandfathered columns for those states.
After all the dust settles, here's what the table looks like now (I've also updated it on yesterday's post):
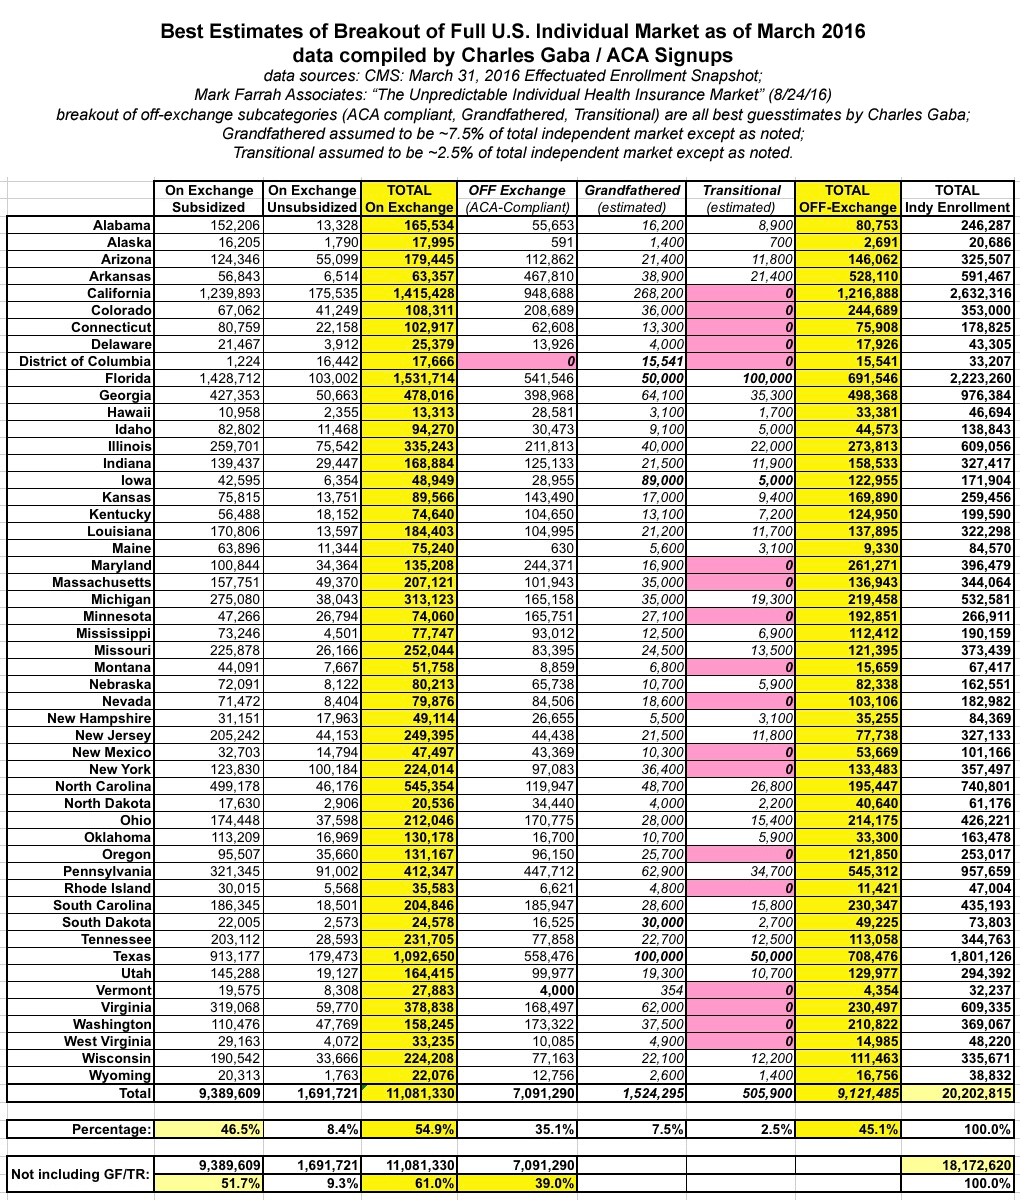
After all that, not much has changed.
ALL OF WHICH BRINGS ME TO THE *ACTUAL* POINT OF THIS ENTRY:
Take a look at this report from May 13, 2016 by the McKinsey Center for U.S. Health System Reform...especially the paragraph at the bottom of Page 7 (including footnote 8):
THERE IS LITTLE RISK OF A MARKET-WIDE SPIRAL GIVEN STABILIZING SUBSIDIES
The individual market has little risk of entering a classic insurance “death spiral” as long as the federal government continues to offer subsidies to those with incomes below 400% of the federal poverty level. Given the unique regulatory conditions of this market, the key determinants of its stability are not the traditional factors (risk and cost of care for this segment), but rather the ongoing subsidy payments.
The majority of enrollees currently in the individual market—an estimated 69% of those in the market, both on and off the exchanges 8—qualify for subsidies, which cap their premium contributions to a percentage of income 9 (Exhibit 7). Our modeling work suggests this mechanism acts as a powerful market stabilizer, making coverage affordable for a broad segment of the individual market regardless of premium increases (albeit at a higher rate of government spending). Similarly, the cost-sharing subsidies offered to many enrollees help stabilize the market but increase government spending. In addition, our modeling suggests that the percentage of enrollees eligible for both types of subsidy will likely rise. Thus, under the current design of subsidized and mandated coverage, there will likely continue to be a large, viable individual market.
8. The overall individual market income distribution was based on McKinsey internal modeling estimates, given the limited data available for off-exchange enrollees. Among on-exchange enrollees specifically, a higher portion are subsidy-eligible; ASPE reported that 83% of 2016 enrollees are receiving subsidies in its March 11, 2016 report, Health Insurance Marketplaces 2016 Open Enrollment Period: Final Enrollment Report (https://aspe.hhs.gov/sites/default/files/pdf/187866/Finalenrollment2016.pdf).
Assuming McKinsey's claim above is accurate, this is an extremely important data point.
Why? Because until now, I've been assuming that since off-exchange enrollees can't receive APTC/CSR assistance, and since anyone over 400% can't receive APTC/CSR even if they enroll on the exchanges, that must mean that virtually all off-exchange enrollees in ACA-compliant plans must logically be those who don't qualify for subsidies.
In other words, until now, I've been assuming that the vast majority--say, 99% or so--of those 7.1 million people who are enrolled in individual plans directly thorugh the carriers must be over 400% FPL, undocumented immigrants, have some other type of legal issue preventing them from enrolling on the exchanges, etc. etc.
HOWEVER, if McKinsey's statement above is accurate, this isn't the case at all.
Why? Because if 69% of the entire individual market (including GR/TR enrollees) is eligible for subsidies, that has to mean that some percentage of off-exchange enrollees are...and not just people in transitional/grandfathered plans.
- The total market is 20.2 million people.
- 69% of that is appx. 12.9 million people McKinsey says are eligible for APTC.
We can account for 9.4 million of those, of course; those are the 9.4 million who are receiving APTC via exchange policies.
Subtract those, and you have another 3.5 million people eligible for APTC assistance out of the 9.1 million total off-exchange enrollees (ACA, GR & TR).
Since there only appear to be about 2 million GR/TR enrollees, that means that at least 1.5 million people enrolled in off-exchange ACA-compliant polices would actually be eligible for subsidized coverage if they were to enroll in the exact same policies (or similar ones) through the exchange.
The actual breakout of this 3.5 million between the ACA, GR & TR crowds is difficult to know for certain, but it's still a huge number of people...far higher than I had expected, in any event. 3.5 out of 9.1 is 38%.
Now, there's still some unknowns here. It's possible that McKinsey is simply wrong; perhaps the eligible population is lower than 69%. Perhaps some of my own estimates above are way off; there could be 3 million GR/TR enrollees instead of 2 million, although that wouldn't really change the 3.5 million eligible figure. Finally, it's conceivable that Mark Farrah Associates is simply wrong about their 20.2 million estimate of the total individual market.
However, assuming that all three of us are in the right ballpark with our various number-crunching, it sure as hell sounds like there's anywhere from 1-2 million people enrolled in ACA-compliant policies (in addition to another million or two in GR/TR plans) who could be receiving tax credits via the exchange...yet aren't. Why aren't these people doing so? Well, there are several reasons I can think of.
In some cases, they may have a perfectly valid reason to enroll directly, in spite of having an income low enough to qualify:
- Their preferred carrier may only be offering their policies OFF exchange, not ON exchange
- The exchange-based policies available might not include their preferred doctor or hospital
- While most off-exchange policies are identical to their exchange-based counterparts, the ACA also allows plans which are ACA-compliant...but which still don't qualify for the exchange itself ("ACA-compliant Non-QHPs"). Some people may find these plans to be a better fit.
- Finally, while having an income under 400% FPL is the main qualifier for receiving APTC, it's not the only one--depending on the cost of the "Benchmark" Silver plan in their area some people under 400% FPL may still not qualify.
For anyone in this group of categories, enrolling directly might very well be the right choice for them.
HOWEVER, my suspicion is that for a large number of these folks, the reason is facepalm-inducing:
- They might simply not realize that they qualify for tax credits in the first place.
- They might know they qualify, but not understand that they only receive the credits if they enroll through the ACA exchange.
- They may have only qualified for a nominal subsidy last year (ie, not worth the bother) and ASSUMED that the subsidy would still be nominal this year...not realizing that the subsidy formula often changes dramatically from year to year.
- They might be so filled with distrust/rage towards "Obamacare"/President Obama that they refuse to use the exchange, even though they're losing out on financial assistance by doing so.
Anyone in this group should absolutely visit HealthCare.Gov (or the state-based exchange, depending on where they live) and shop around this November; they might be pleasantly surprised to discover that they've been eligible for hundreds or thousands of dollars in assistance all along without even realizing it!
Advertisement
