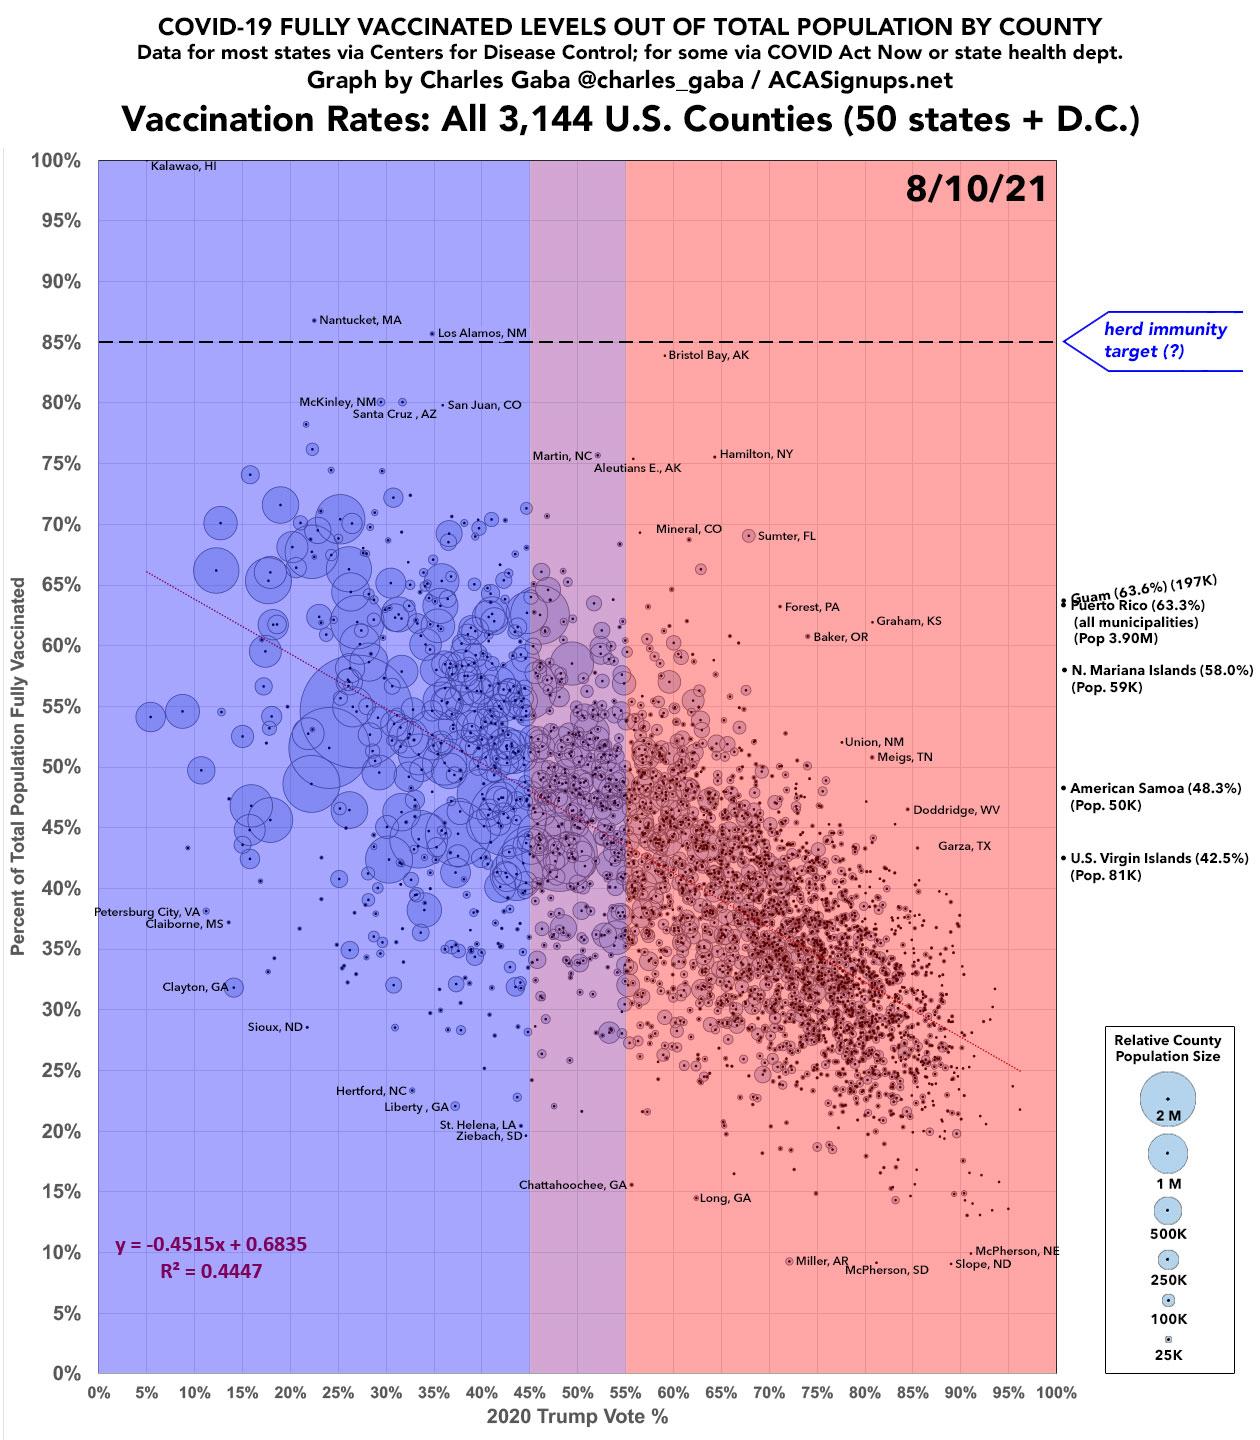
Weekly Update: U.S. #COVID19 vaccination levels BY COUNTY & Partisan Lean
Wed, 08/11/2021 - 6:49pm

Methodology reminders:
- For my county-level vaccination rate graphs, I go by FULLY vaccinated only (2 doses of the Pfizer or Moderna vaccine or one dose of the Johnson & Johnson vaccine).
- I base my percentages on the total population, as opposed to adults only or those over 11 years old.
- For 42 states + DC I use the daily data from the Centers for Disease Control, but there are some where the CDC is either missing county-level data entirely or where the CDC data is less than 90% complete at the county level. Therefore:
- For Hawaii, Vermont, Virginia and West Virginia, I'm using data from the COVID Act Now Risk & Vaccine Tracker database.
- For Colorado, Georgia, New Mexico and Texas, I'm using their COVID vaccine dashboards set up by the state health departments.
- For California, I'm using the CDC data for most counties and the state health dept. dashboard data for the 8 small counties which the CDC isn't allowed to post data for.
- For Massachusetts, I'm using the CDC data for most counties but this municipality-level data for Barnstable, Dukes & Nantucket counties, which the CDC only has partial data for.
- The 5 major U.S. territories don't vote for President in the general election, preventing me from displaying them in the main graph, but I have them listed down the right side.
Worth noting:
- At first glance, the graph may look identical to prior weeks, but the R^2 is gradually increasing:
- On May 25th, R^2 stood at 0.2650 (granted, I had some methodology errors at the time)
- On July 3rd, R^2 stands at 0.4216
- On July 11th, R^2 stands at 0.4270
- On July 20th, the R^2 stood at 0.4363
- On July 27th, the R^2 stood at 0.4408
- On August 3rd, the R^2 stood at 0.4438
- On August 10th, the R^2 stood at 0.4447
- Only 3 counties have broken the 85% threshold for full vaccination: Kalawao County, HI (pop. 86), Nantucket, MA (pop. 11,400) and Los Alamos County, NM (pop. 14,700). Bristol Bay Borough, AK (pop. 900) is next in line, however, at 83.9%.
- Slope County, ND (pop. 43,200) has the lowest vaccination rate in the country at just 9.1%. It's one of 4 counties nationally which have vaccinated less than 10% of their total populations, along with Miller County, AR (pop. 43,300), McPherson County, SD (pop. 2,400) and McPherson County, NE (pop. 500).
- Of counties with more than 100,000 residents, the top-vaxxed are Santa Fe, NM (76.2% vaxxed); Marin County, CA (74.1% vaxxed); and Cumberland County, ME (72.2% vaxxed)
- Of counties with more than 100,000 residents, the least-vaxxed are Shelby County, AL; Robeson County, NC; and Livingston County, LA, each of which has fully vaccinated less than 27% of their total populations to date.
- There are 45 counties with more than 1 million residents. Of those, the highest-vaxxed is Montgomery County, MD (71.6% vaxxed) while the lowest-vaxxed is San Bernadino County, CA (41.2%).
How to support my healthcare wonkery:
1. Donate via ActBlue or PayPal
2. Subscribe via Substack.
3. Subscribe via Patreon.


