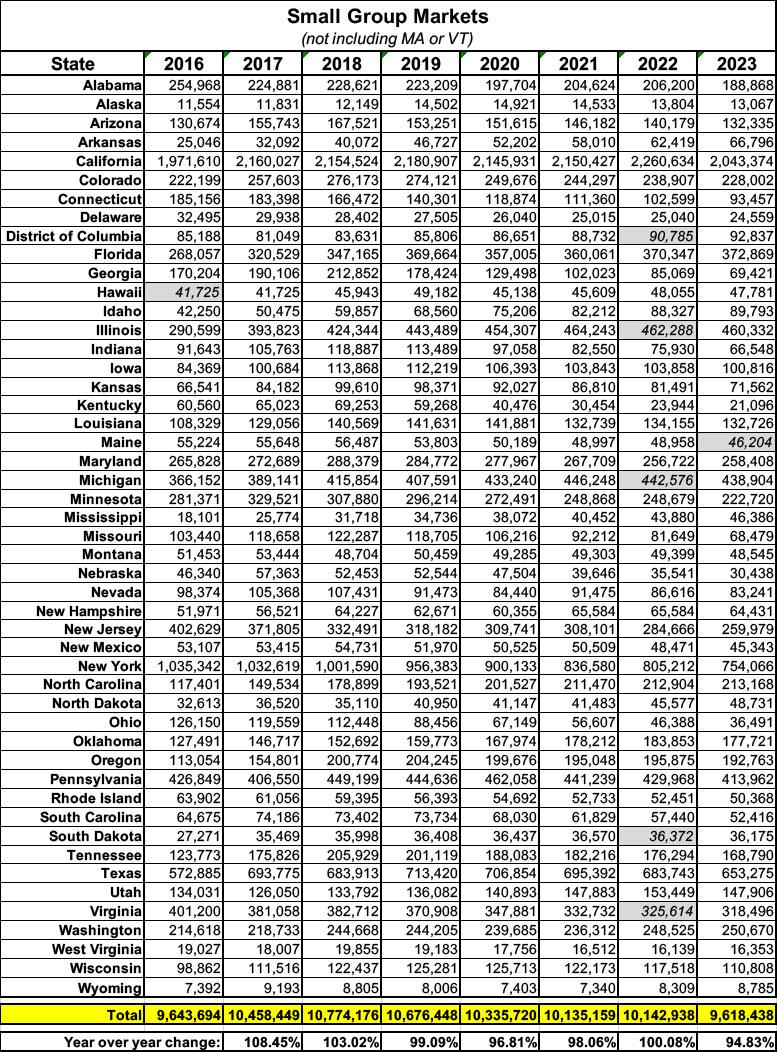
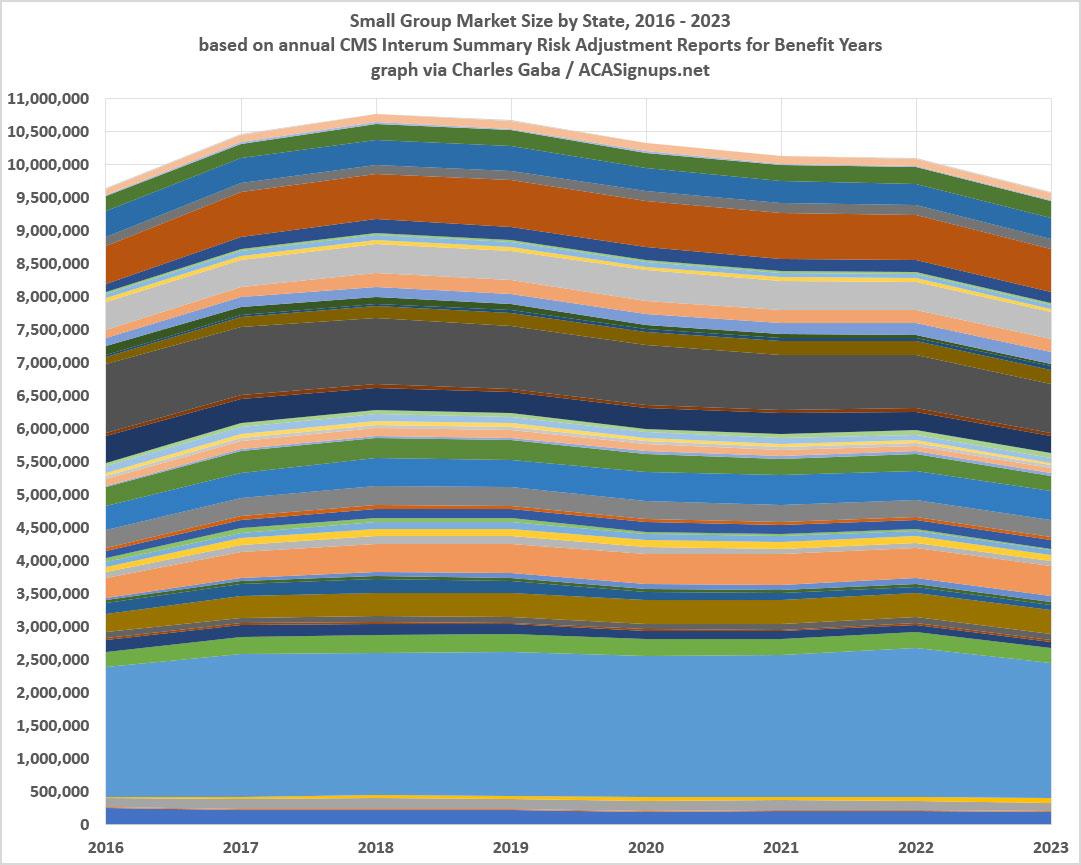
Meanwhile, the Small Group Market is...pretty much exactly where it was a decade ago. (updated)

I don't really write a whole lot about the Small Group Market, which consists of employer-sponsored healthcare coverage for companies with fewer than either 50 employees (in a few states the small group market serves companies with up to 100 employees).
The bulk of my small group market analysis is limited to my annual Rate Change project, where I break out & analyze annual premium rate changes for carriers in both the individual and small group markets. However, even then, while I try to run the numbers for the small group market in each state, I usually don't have much to say about it, and a lot of states don't provide actual carrier-level enrollment data publicly anyway, which means I can usually only run an unweighted average rate change at best.
As my colleague Louise Norris explains:
Small-group plans effective since January 2014 are required to fully comply with Affordable Care Act (ACA) rules that apply to individual and small-group health plans.
Insurers can’t use a group’s medical history to set premiums for ACA-compliant small-group plans, and premiums for older employees cannot be more than three times those for younger employees. ACA-compliant small-group plans also have to fit into one of the four metal levels and cover the ACA’s essential health benefits with no dollar limits on how much the health plan will pay for a member’s treatment.
In other words, it's a bit of an odd duck, caught between the individual market and large employer populations, with most (but not all) of the regulatory requirements of the former but the general business model of the latter.
Businesses can buy small-group plans at any time of the year, directly from an insurance company, via a broker or private exchange, or from a state’s SHOP exchange (most states no longer have SHOP exchange plans available, but some do; in the District of Columbia, small group plans can only be obtained in the SHOP exchange).
In most states, insurers can impose participation requirements (in terms of the percentage of employees who sign up for the coverage) as well as employer contribution requirements (in terms of the amount of the premiums covered by the employer, as opposed to being payroll deducted). But there’s a one-month window each year, from November 15 to December 15, when small group coverage is guaranteed-issue even to small groups that don’t meet the normal participation or contribution requirements.
Purchase of a SHOP plan may qualify the buyer for the Small Business Health Care Tax Credit. In states that use Healthcare.gov, SHOP plans are now purchased directly through the insurance companies, or with the help of a SHOP-certified broker, although there are no SHOP-certified plans available anymore in most states that use HealthCare.gov (meaning the Small Business Health Care Tax Credit isn’t available to employers).
I should note that there are a couple of alternatives to small group coverage for small businesses as well:
...Small groups can choose to self-insure rather than purchase ACA-compliant health insurance from an insurance company. Self-insurance is the primary type of coverage used by large employers. And although it’s not as common among small employers, it is possible, especially in conjunction with a stop-loss policy.
Another option is to use a QSEHRA or ICHRA, both of which involve the employer reimbursing employees for the cost of self-purchased health coverage.
In any event, Louise inspired me to look into how many Americans are enrolled in small group plans.
I've had trouble finding solid state-level data on this, so our fellow colleague David Anderson recommended looking into the annual Interim Summary Risk Adjustment Reports for the individual & small group markets.
These are available for every year from 2015 - 2023, although the 2015 report only includes data for about a dozen states, which makes it useless for my purposes. For every other year, there's at least 45 states included in the reports; enough that I'm comfortable filling in estimates for the missing ones.
These reports include a bunch of Risk Adjustment-related data (some of which I don't really understand well enough to write about), but the last column is the key one, as it lists the State Billable Member Months. If you divide this number by 11 (not 12 as you might assume), it gives a rough approximation of the total number of lives covered in that market in that state that year.
It's not precise, of course, because there will always be some employees and/or their dependents who join or leave the company (and its healthcare plan) throughout the year, but it should be pretty close.
After downloading & compiling this data for every CMS Risk Adjustment report from 2016 - 2023 and putting them all together by state, what I found is that the small group market has...stayed pretty much exactly the same overall for at least the past 8 years, nationally.
I can't include Massachusetts or Vermont as both states have merged their individual & small group markets together for risk adjustment purposes, and there were a handful of states missing in a couple of years (2022 in particular has 5 states missing, not sure why). Otherwise, however, the U.S. small group market has ranged within a pretty narrow range of 9.6 - 10.8 million over the years. In fact, as of 2023 it was right back where it was in 2016, at a bit over 9.6 million.
That's very much in line with this report from the Commonwealth Fund, which put the small group market a tad lower at 9.5 million in 2023.
I should note that while the Risk Adjustment totals are a bit higher if you could separate out the MA & VT sm. group numbers, the merged markets have dropped from 915K combined in 2016 to 733K in 2023...down about 20%.
I really don't have much else to add here. There was a small bump in sm. group enrollment during the first half of the first Trump Administration, followed by a small drop during the COVID pandemic and the Biden Administration...but nothing dramatic. I was actually rather surprised that it didn't drop off more significantly during COVID, but (shrug).
The only factor I can think of which might be causing the ~10% drop from the peak in 2017 is the introduction and expansion of ICHRA enrollments (ICHRA was rolled out by the Trump Administration in 2019, and while the Biden Administration didn't champion them, they didn't try to revoke ICHRAs either).
So what to make of this? Honestly, possibly nothing. But...there you have it.
Update 12/17/24: Hmmm...in the comments, farmbellpsu reminds me that:
The nongrandfathered (grandmothered) and grandfathered small groups are not captured in the Risk Adjustment reports. It took a few years, but some carriers have since terminated those plan options. This would mean that the small group market was actually larger in the earlier years.
As you included, the self-funding, level funding, group captives, and ICHRAs have created alternative avenues for the healthier small groups.
This is an excellent point which I admit to having completely forgotten about. It's also supported by this Commonwealth Fund article which puts the small group market at 17.4 million in 2012, dropping gradually to 13.6 million by 2016...the same year my own table below begins (at just 9.6 million).
On the other hand, there's also this estimate from the Urban Institute which puts employee only enrollment in small group plans (not including dependents) at around 9.5 million in 2013 and has it staying between 8.9 - 9.6 million from 2013 - 2020. So...I have no idea what to make of this now.
How to support my healthcare wonkery:
1. Donate via ActBlue or PayPal
2. Subscribe via Substack.
3. Subscribe via Patreon.


