

Nine Years of #ACA Medicaid Expansion in One Image
Fri, 05/05/2023 - 1:59pm
Back in January, as the 2023 Open Enrollment Period wound down, I posted a colorful graph which tracked ACA Qualified Health Plan (QHP) enrollment over ten years of Open Enrollment Periods.
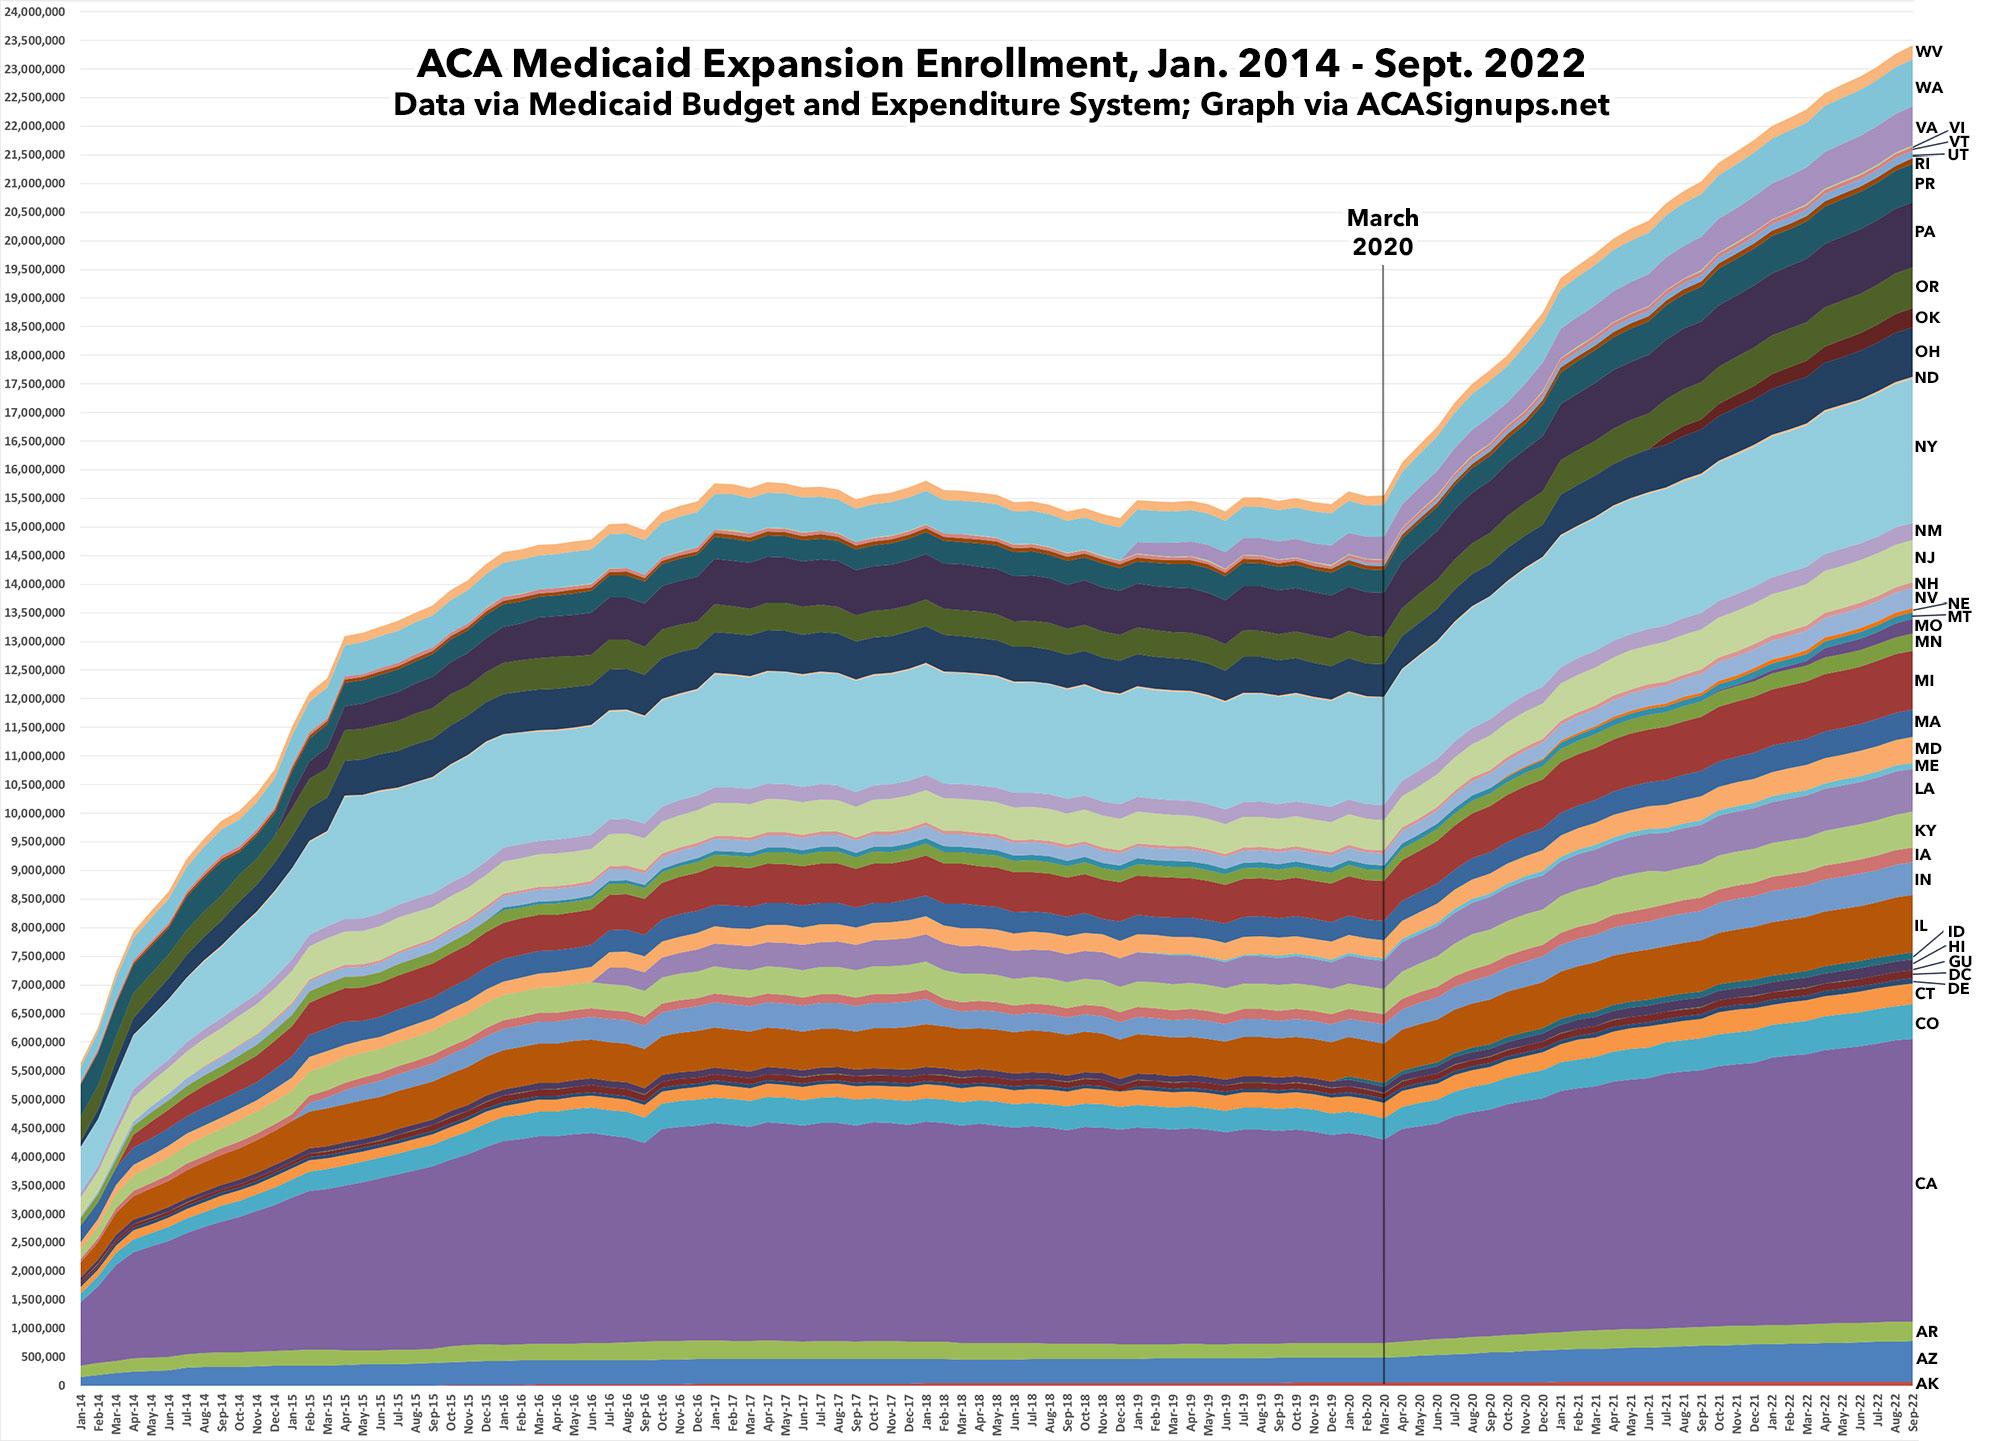
Today I'm doing the same thing for ACA Medicaid Expansion. The data comes from the Centers for Medicare & Medicaid Services monthly Medicaid Budget & Expenditure System reports.
Unfortunately the MBES reports only run through September 2022; my best guess is that the national total as of March 2023 was up to around 24.4 million or so, roughly 900K higher than what's shown below.
Also keep in mind that if the remaining 10 states had expanded Medicaid under the ACA by now, the grand total would have been up to 3.5 million higher (around 27.9 million nationally).
Aside from various holdout states jumping in as the years have passed, the most notable milestone was the month that the COVID pandemic hit the U.S. in full force, shutting businesses down across the country in March 2020.
No further analysis or comment here; I just think this is a pretty cool graphic...and keep in mind that most of the ~23.5 million people represented here (again, likely over 24M today) would have been utterly screwed without the Affordable Care Act being in place when the pandemic hit. Click the image for a higher-resolution version; the states are listed on the right-hand side, though they might be difficult to make out:
Advertisement
