

September (& Final) Update: County-level #COVID19 vaccination levels by Partisan Lean
Sun, 09/11/2022 - 1:12pm
I spent over a year posting weekly updates to my vaccination-rate-by-partisan-lean graph. I then moved to monthly updates as I was backed up with other work, and my last one was back in July.
This will be my final update of this graph for four reasons:
- First: I've more than made my point. There's really not much more to be said about the absurd & disturbing partisanship of COVID-19 vaccination rates that hasn't already been discussed ad nauseum here and elsewhere.
- Second: The 1st- & 2nd-dose vaccination rates have slowed to a trickle across the nation overall anyway; by my count, only around 1.2 million Americans have completed their 2nd vaccination dose since mid July. That's only around 22,000 per day nationally.
- Third, we're now 2 1/2 years out from the official 2020 Census population data, which means the denominator I've been dividing into for all of this data is now pretty out of date.
- And fourth, the addition of 3rd & 4th shots (boosters as they're called), along with the just-approved Omicron-specific vaccine doses, have muddied the data waters pretty badly in a lot of parts of the country, with doses being miscategorized in databases, etc.
Having said that, here's my methodology reminders:
- I go by county residents who have received the 2nd COVID-19 shot only (or 1st in the case of the J&J vaccine).
- I base my percentages on the total population via the 2020 U.S. Census including all ages (i.e., it includes kids under 12).
- For most states + DC I use the daily data from the Centers for Disease Control, but there are some where the CDC is either missing county-level data entirely or where the CDC data is less than 90% complete at the county level. Therefore:
- For Vermont , Virginia and West Virginia, I'm using data from the COVID Act Now Risk & Vaccine Tracker database
-
- For California, Colorado, Georgia, Hawaii, Minnesota and Texas, I'm using their COVID vaccine dashboards set up by the state health departments.
- For Massachusetts, I use CDC data for most counties but the official Massachusetts Health Dept. weekly data report for Barnstable, Dukes & Nantucket counties, which the CDC only has partial data for.
- The 5 major U.S. territories don't vote for President in the general election, preventing me from displaying them in the main graph, but I have them listed down the right side.
- Alaska's 2020 election results are estimated thanks to an updated analysis by RRH Elections (all other states +DC have been using 2020 county-level election data all along).
- There are several counties which have supposedly surpassed 100% vaccination rates; obviously that's impossible, and is due to discrepancies in either the vaccination data or actual population counts. In addition, people have moved, died, etc. since the 2020 Census was locked in as of April 2020. With that in mind, I've started setting the maximum vaccination rate for any county at 98%.
With all this in mind, here's what things looked like as of September 7th, 2022:
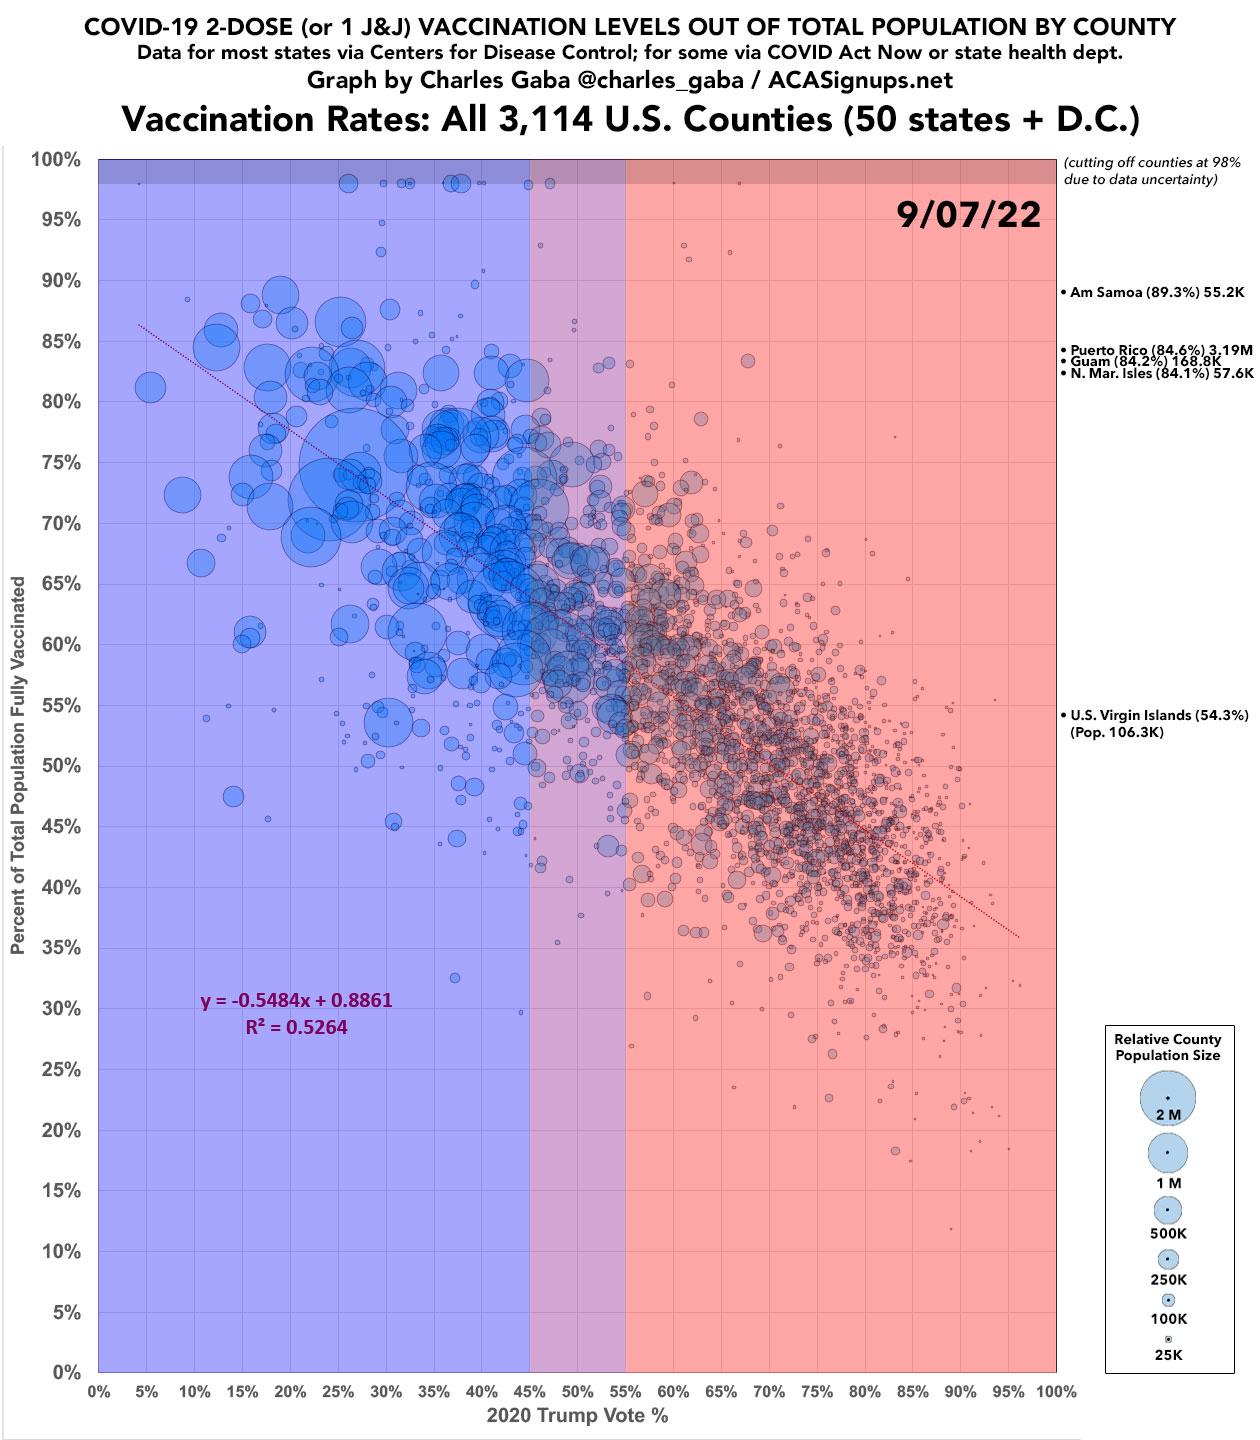
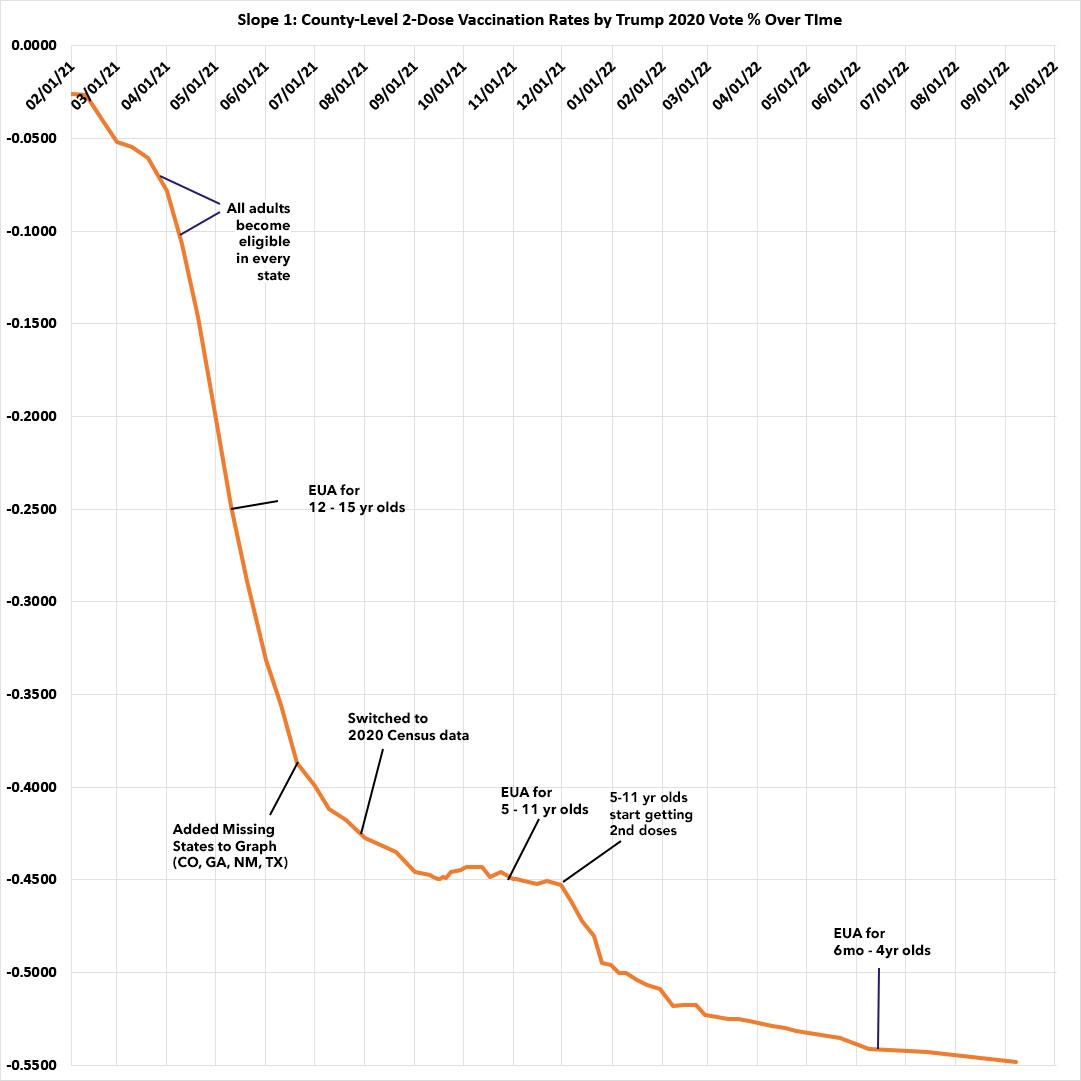
And yes, the correlation (R^2) and slope angle are still continuing to gradually inch their way higher. As I predicted back in July, there's been a slight bump since then, since the first batches of 6mo - 4yr old children have started getting their 2nd or 3rd vaccination dose:

- There are still only 22 counties where over 90% of their populations have received their 2nd shot, with ~1.12 million residents, including:
- Bristol Bay, AK (pop. 844)
- Apache County, AZ (pop. 66,021)
- Santa Cruz County, AZ (pop. 47,669)
- (Note: there's a serious discrepancy between the official CDC vaxx rate & the AZ Health Dept. for both Apache & Santa Cruz)
- Imperial County, CA (pop. 179,702)
- San Juan County, CO (pop. 705)
- Kalawao County, HI (pop. 82)
- West Feliciana Parish, LA (pop. 15,310)
- Big Horn County, MT (pop. 13,124)
- Rosebud County, MT (pop. 8,329)
- McKinley County, NM (pop. 72,902)
- Dewey County, SD (pop. 5.239)
- Brooks County, TX (pop. 7,076)
- Hudspeth County, TX (pop. 2,912)
- Maverick County, TX (pop. 57,887)
- Presidio County, TX (pop. 6,131)
- Reeves County, TX (Pop. 14,748)
- Starr County, TX (pop. 65,920)
- Webb County, TX (pop. 267,114)
- Charles City, VA (pop. 6,773)
- Fairfax City, VA (pop. 24,146)
- Norfolk City, VA (pop. 238,005)
- Teton County, WY (pop. 21,073)
- There are only 89 counties where over 80% of their total populations have received their 2nd shot, with ~28.2 million residents.
- There are now 301 Counties with 112 million residents where over 70% of the total populations have received their 2nd shot.
- 154 of these counties have more than 100,000 residents.
- At the opposite end, over a year after all adults have been eligible to get vaccinated, there's still 21 counties which have vaccinated less than 25% of their total populations, with ~179,000 residents:
- Winston County, AL (pop. 23,540)
- Crowley County, CO (pop. 5,922)
- LaGrange County, IN (pop. 40,446)
- Cameron County, LA (pop. 5,617)
- Garfield County, MT (pop. 1,173)
- McCone County, MT (pop. 1,729)
- Powder River County, MT (pop. 1,694)
- Arthur County, NE (pop. 434)
- Grant County, NE (pop. 611)
- Logan County, NE (pop. 716)
- McPherson County, NE (pop. 399)
- Storey County, NV (pop. 4,104)
- Billings County, ND (pop. 945)
- Grant County, ND (pop. 2,301)
- McKenzie County, ND (pop. 14,704)
- Slope County, ND (pop. 706)
- Holmes County, OH (pop. 44,223)
- Harding County, SD (pop. 1,311)
- Moore County, TN (pop. 6,461)
- Gaines County, TX (pop. 21,598)
- King County, TX (pop. 265)
- There's still 4 counties with more than 100,000 residents which have vaccinated less than 40% of their total populations:
- Lee County, AL (pop. 174241)
- Limestone County, AL (pop. 103570)
- Shelby County, AL (pop. 223024)
- Warren County, KY (pop. 134,554)
- There are 49 counties with more than 1 million residents. Of those, the highest-vaxxed is Montgomery County, MD (88.8% vaxxed) while the lowest-vaxxed is Wayne County, MI (home of Detroit), which has only vaccinated 53.6% of its population.
Advertisement
