

Weekly Update: County-level #COVID19 vaccination levels by 2020 Partisan Lean
Mon, 02/21/2022 - 10:41am
Methodology reminders:
- I go by county residents who have received the 2nd COVID-19 shot only (or 1st in the case of the J&J vaccine).
- Note: I've temporarily stopped tracking boosters again, as it appears that the data on this front is still too confused to get an accurate county-level national read.
- I base my percentages on the total population via the 2020 U.S. Census as opposed to adults only or those over 11 years old (or even over 4 years old).
- For most states + DC I use the daily data from the Centers for Disease Control, but there are some where the CDC is either missing county-level data entirely or where the CDC data is less than 90% complete at the county level. Therefore:
- For Vermont and West Virginia, I'm using data from the COVID Act Now Risk & Vaccine Tracker database
- For Virginia, I'm using the official state health department dashboard, but am only updating it once a month since it doesn't allow you to export, view or download all 95 counties/city-counties at once, making this a tedious effort.
-
- For California, Colorado, Georgia, Hawaii, Minnesota and Texas, I'm using their COVID vaccine dashboards set up by the state health departments.
- For Massachusetts, I use CDC data for most counties but the official Massachusetts Health Dept. weekly data report for Barnstable, Dukes & Nantucket counties, which the CDC only has partial data for.
- The 5 major U.S. territories don't vote for President in the general election, preventing me from displaying them in the main graph, but I have them listed down the right side.
- Alaska's 2020 election results are estimated thanks to an updated analysis by RRH Elections (all other states +DC have been using 2020 county-level election data all along).
- BY POPULAR REQUEST, here's an updated Google Spreadsheet with all the relevant data.
- There are several counties which have supposedly surpassed 100% vaccination rates; obviously that's impossible, and is due to discrepancies in either the vaccination data or actual population counts. In addition, people have moved, died, etc. since the 2020 Census was locked in as of April 2020. With that in mind, I've started setting the maximum vaccination rate for any county at 98%.
With all this in mind, here's what things looked like as of February 21st, 2022:
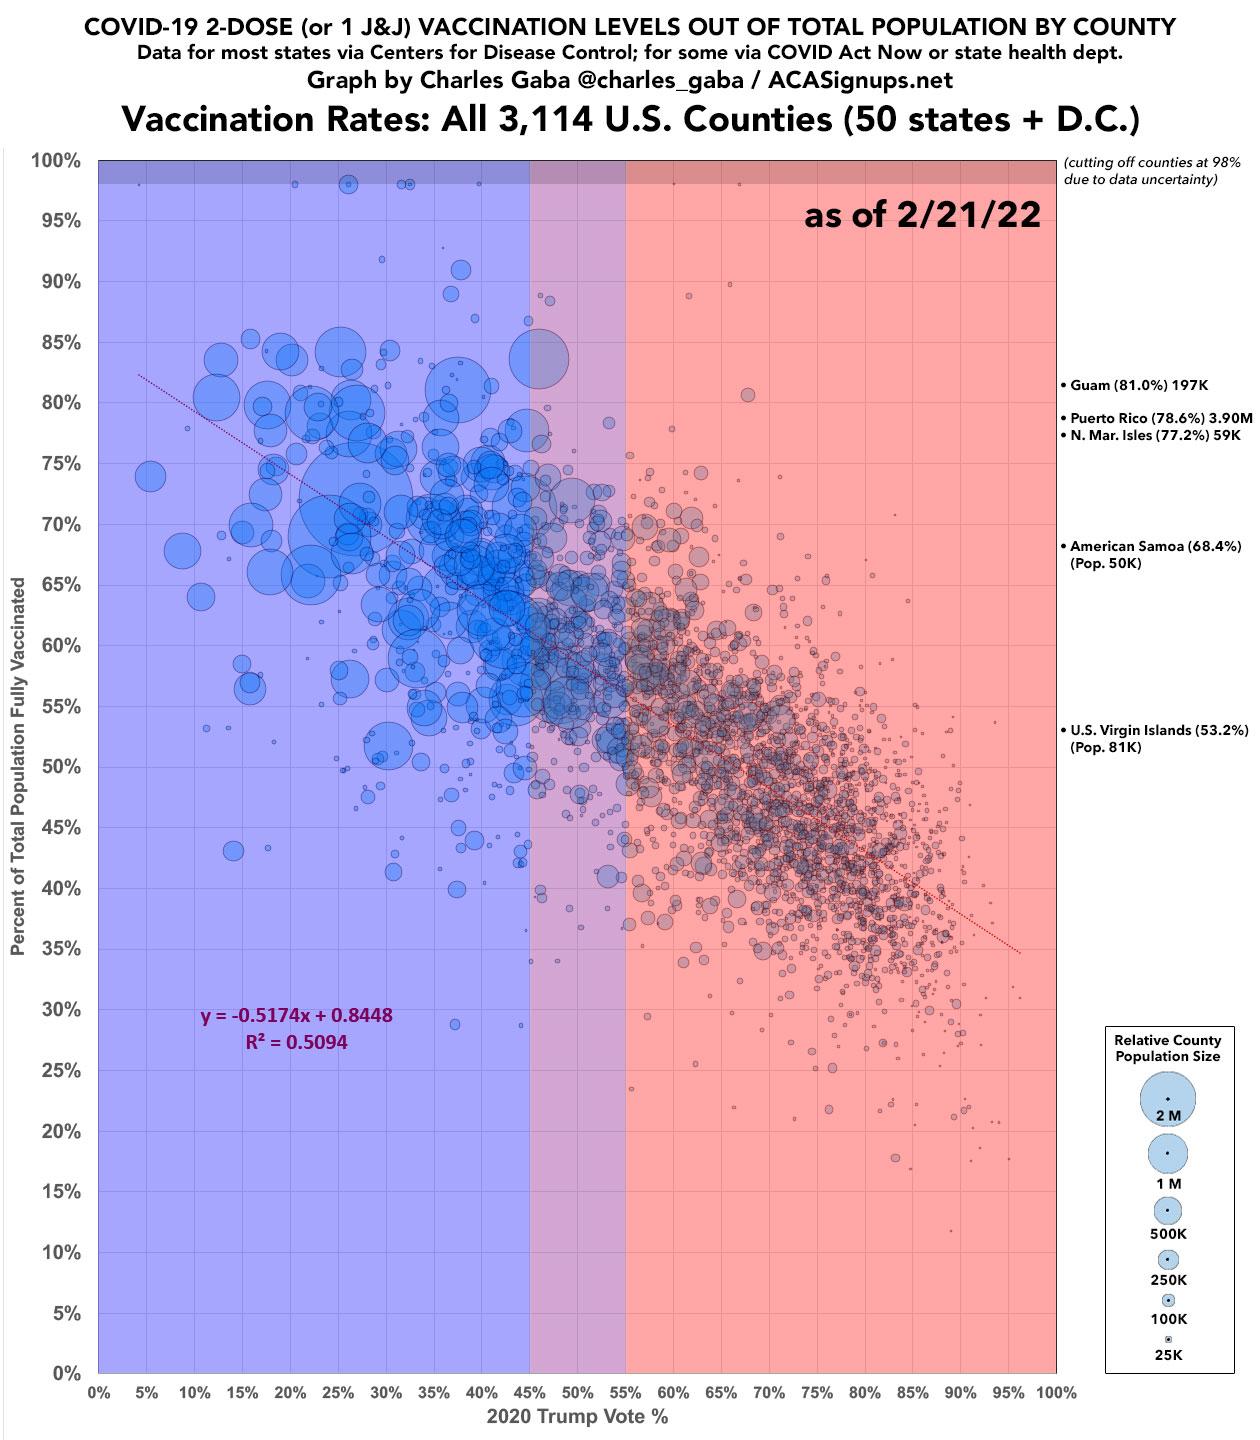
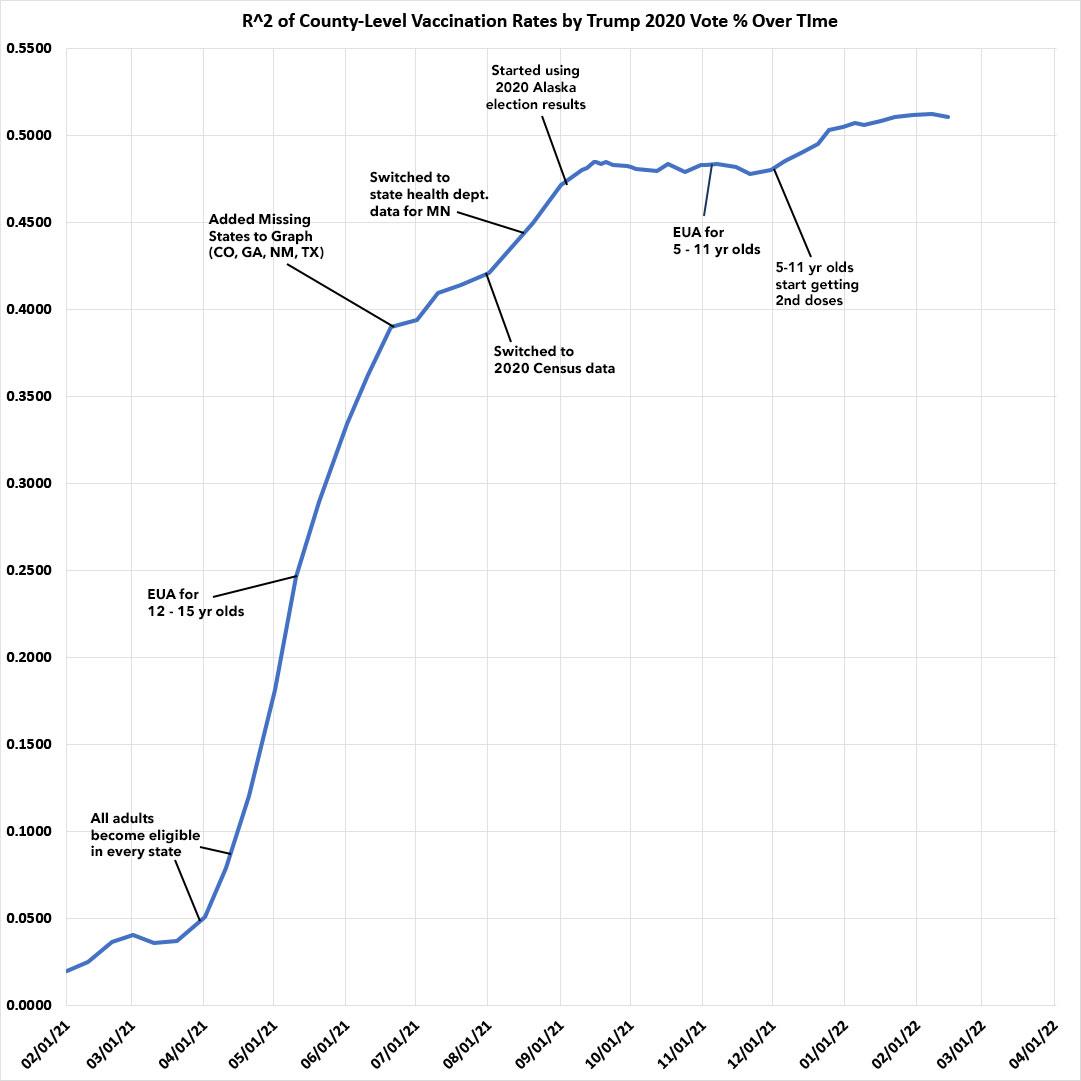
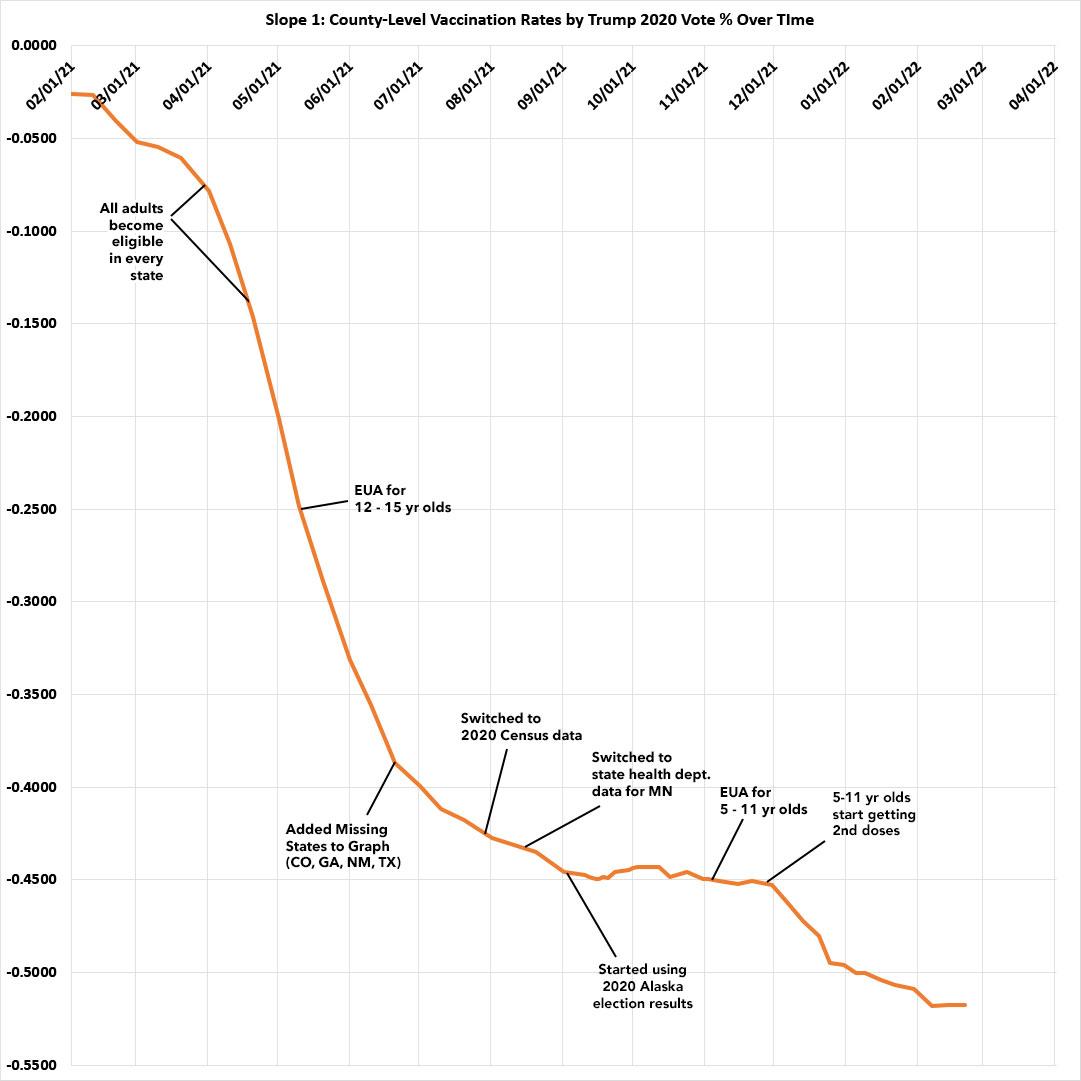
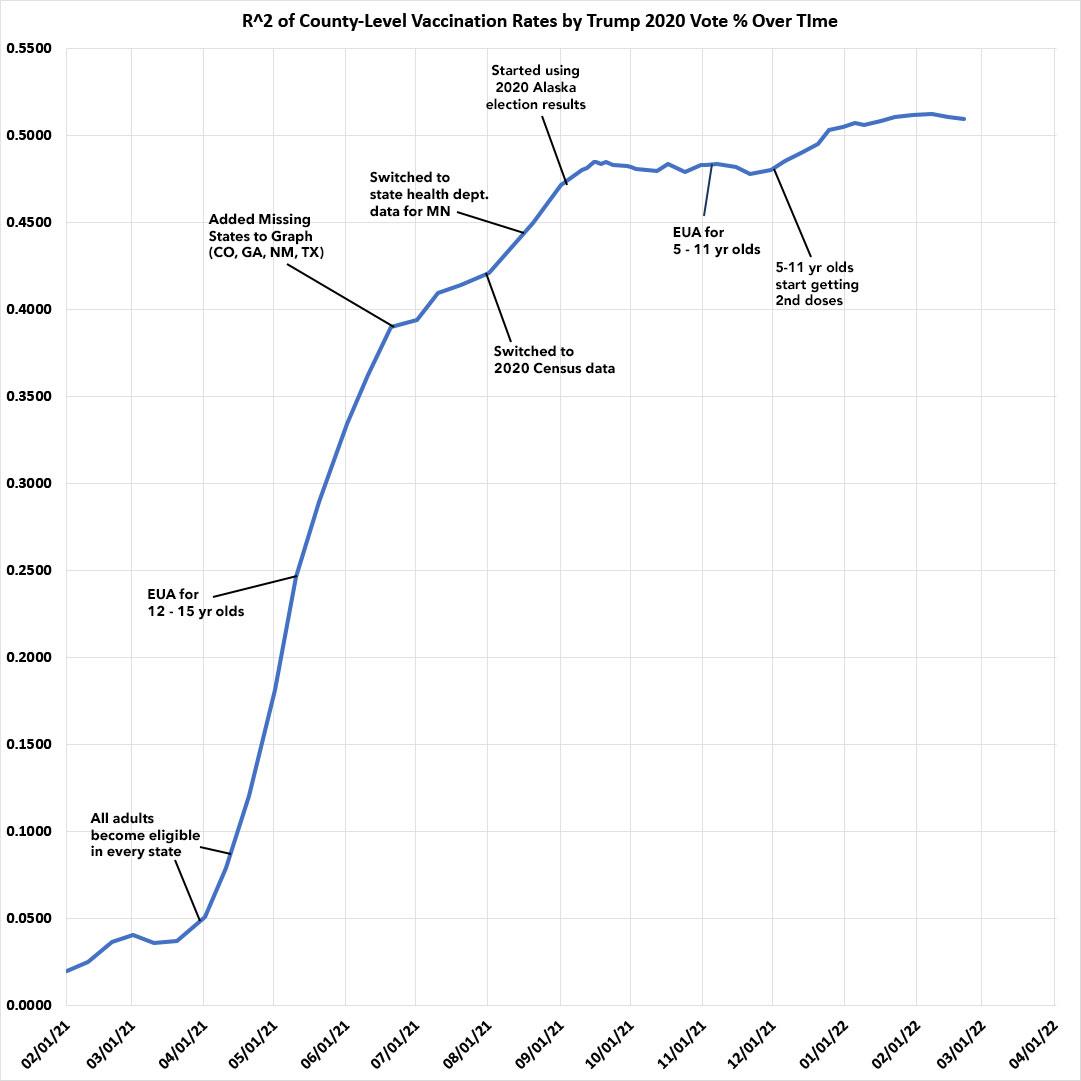
It looks like the mini-spike of the R-squared and slope lines increasing in response to 5-11 yr olds receiving their 2nd COVID shots starting around Thanksgiving has leveled off again; both lines have flatlined again for the past two weeks. I'd imagine there will be one more final mini-spike once children under 5 years old are approved to get vaccinated as well; after that there's really no way for the slope to increase any further as the bluest counties are starting to bump up against their likely vaccination rate ceilings.
SPECIAL: I should also note that someone who knows how to do it has also weighted the data by county population, and said they get the following:
- y=-.49795x+.84184
- r^2=.5394
In other words, when weighted by population, the slope is slightly less steep than shown above, but the correlation is somewhat higher than shown above.
- There's 13 Counties where over 90% of their populations have received their 2nd shot, with ~694,000 residents, including:
- Bristol Bay, AK (pop. 844)
- Apache County, AZ (pop. 66,021)
- Santa Cruz County, AZ (pop. 47,669)
- (Note: there's a serious discrepancy between the official CDC vaxx rate & the AZ Health Dept. for both Apache & Santa Cruz)
- San Juan County, CO (pop. 705)
- Kalawao County, HI (pop. 82)
- Dukes County, MA (pop. 20,600)
- Nantucket County, MA (pop. 14,255)
- Hudspeth County, TX (pop. 2,912)
- Presidio County, TX (pop. 6,131)
- Webb County, TX (pop. 267,114)
- Charles City, VA (pop. 6,773)
- Norfolk City, VA (pop. 238,005)
- Teton County, WY (pop. 21,073)
- There's 50 Counties where over 80% of their total populations have received their 2nd shot, with ~16.5 million residents.
- There's 204 Counties with 79.5 million residents where over 70% of the total populations have received their 2nd shot.
- 98 of these counties have more than 100,000 residents.
- At the opposite end, there's still 22 counties which have vaccinated less than 25% of their total populations, with ~188,000 residents:
- Winston County, AL (pop. 23,540)
- Crowley County, CO (pop. 5,922)
- Chattahoochee County, GA (pop. 9,565)
- LaGrange County, IN (pop. 40,446)
- Cameron County, LA (pop. 5,617)
- Garfield County, MT (pop. 1,173)
- McCone County, MT (pop. 1,729)
- Powder River County, MT (pop. 1,694)
- Arthur County, NE (pop. 434)
- Grant County, NE (pop. 611)
- Logan County, NE (pop. 716)
- McPherson County, NE (pop. 399)
- Storey County, NV (pop. 4,104)
- Billings County, ND (pop. 945)
- Grant County, ND (pop. 2,301)
- McKenzie County, ND (pop. 14,704)
- Slope County, ND (pop. 706)
- Holmes County, OH (pop. 44,223)
- Harding County, SD (pop. 1,311)
- Moore County, TN (pop. 6,461)
- Gaines County, TX (pop. 21,598)
- King County, TX (pop. 265)
- There's 14 counties with more than 100,000 residents which have vaccinated less than 40% of their total populations:
- Etowah County, AL (pop. 103436)
- Lee County, AL (pop. 174241)
- Limestone County, AL (pop. 103570)
- Shelby County, AL (pop. 223024)
- Tuscaloosa County, AL (pop. 227036)
- Bartow County, GA (pop. 108,901)
- Carroll County, GA (pop. 119,148)
- Lowndes County, GA (pop. 118,251)
- Muscogee County, GA (pop. 206,922)
- Paulding County, GA (pop. 168,661)
- Warren County, KY (pop. 134,554)
- Calcasieu County, LA (pop. 216,785)
- Livingston County, LA (pop. 142,282)
- Anderson County, SC (pop. 203,718)
- There are 49 counties with more than 1 million residents. Of those, the highest-vaxxed is Montgomery County, MD (84.2% vaxxed) while the lowest-vaxxed is Wayne County, MI (home of Detroit), which has only vaccinated 51.7% of its population.
Advertisement
