

Weekly Update: U.S. #COVID19 vaccination levels BY COUNTY
Wed, 07/21/2021 - 12:28pm
I was planning on only updating the county-level vaccination graph monthly, but given the attention this has received via high-profile folks like David Frum and Paul Krugman, I've decided to post updates weekly.
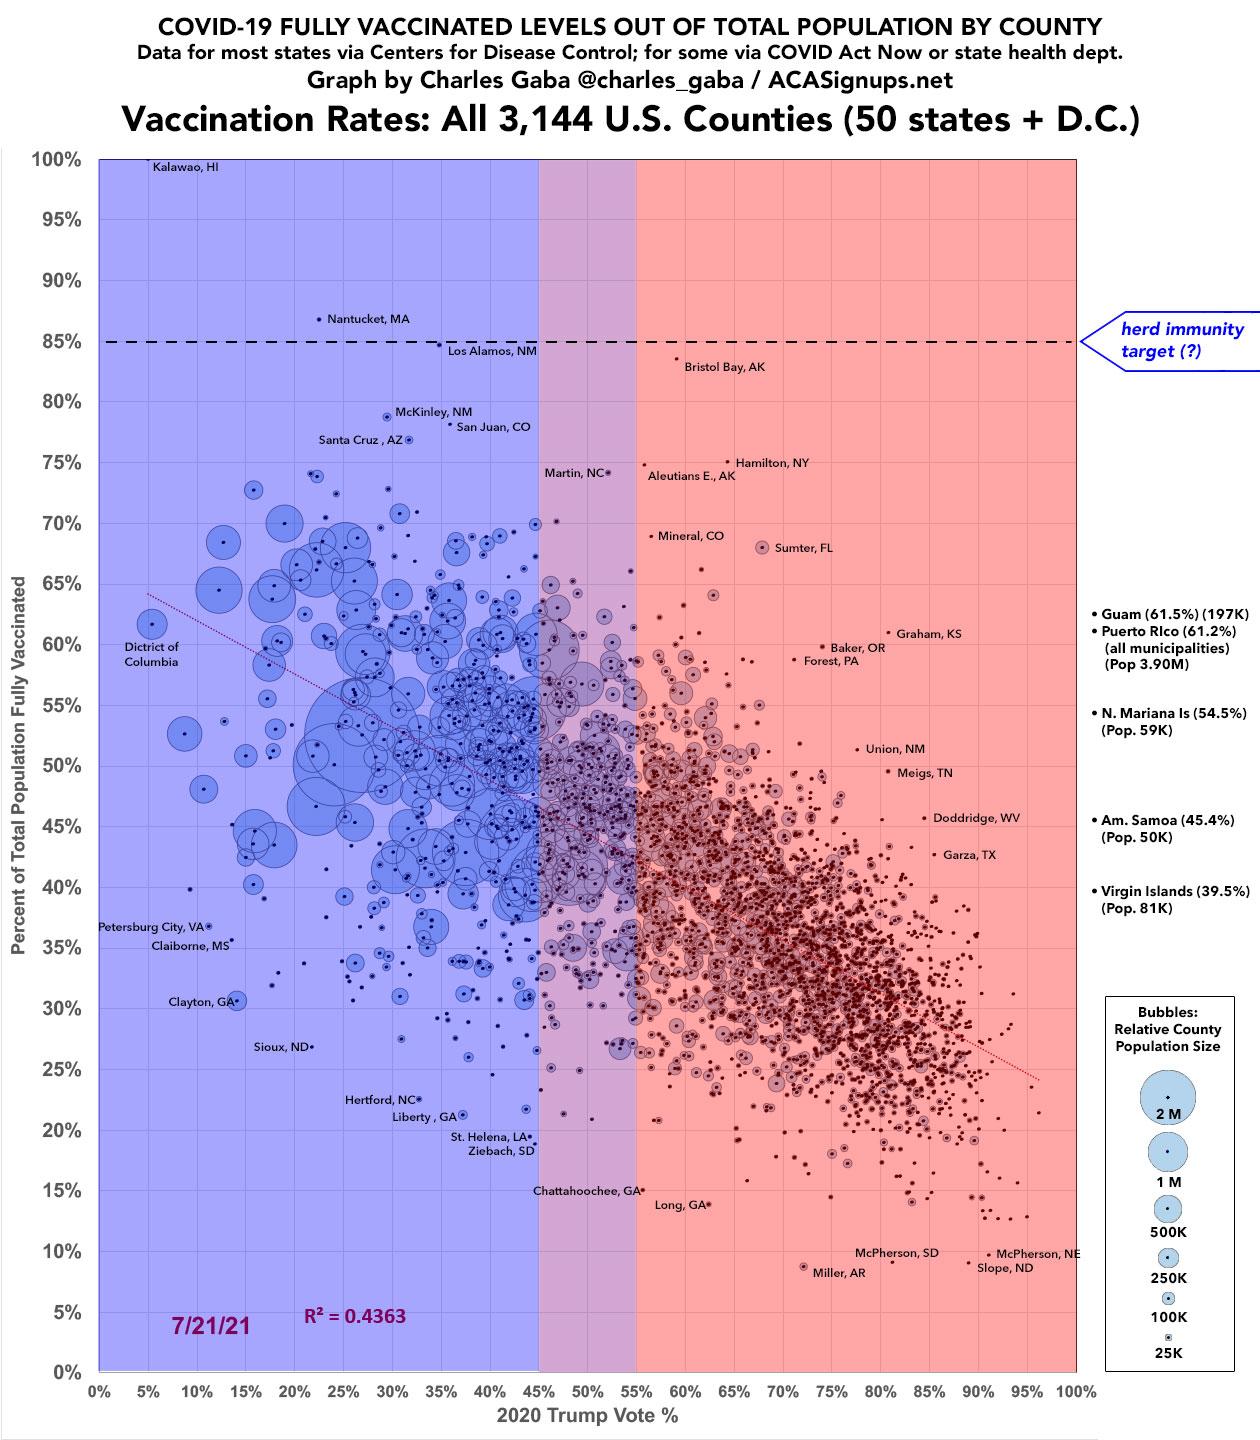
With the more aggressive Delta variant now spreading quickly among the unvaccinated in the U.S., 85% of the total population seems to indeed be the more likely threshold which will be needed to achieve herd immunity.
As a reminder:
- I'm now counting those FULLY vaccinated only. This is defined as those who have received either 2 doses of the Pfizer or Moderna vaccine or one dose of the Johnson & Johnson vaccine. In the future it's possible that a single J&J dose may be downgraded to only "half-vaccinated" but it's too early to tell.
- For most states I'm using the daily data from the Centers for Disease Control, but there are some where the CDC is either missing county-level data entirely (Hawaii, Texas, some counties in California) or where the CDC data is less than 90% complete at the county level:
- For Hawaii, Vermont, Virginia and West Virginia, I'm relying on data from the COVID Act Now Risk & Vaccine Tracker database.
- For Colorado, Georgia, New Mexico and Texas, I'm using their COVID vaccine dashboards set up by the state health departments.
- For California, I'm using the CDC data for most counties and the state health dept. dashboard data for the 8 small counties which the CDC isn't allowed to post data for.
- For Massachusetts, I'm using the CDC data for most counties but this municipality-level data for Barnstable, Dukes & Nantucket counties, which the CDC is only allowed to post partial data for (like CA, they say it's due to the low populations, but Barnstable has over 200,000 residents so that doesn't make much sense).
- The local tracker claims that 95% of the population of Nantucket, 75% in Dukes and 78% in Barnstable have been vaccinated. Since there's no way to hit 95% in any county with more than a nominal number of young children (who can't get vaccinated at all), I'm operating on the assumption that these figures refer to the population over 12 years old only. If so, the actual percentages for each are lower: 86.8%, 66.8% and 68.6% respectively.
- UPDATE: I've also managed to work the 5 major U.S. territories into the graph by adding them down the right side (they aren't sized by population but the bullets are at least at the right height for each). I can't put them in th emain graph because none of them vote for President in the general election.
Worth noting:
- On May 25th, R^2 stood at 0.2650
- On July 3rd, R^2 stands at 0.4216
- On July 11th, R^2 stands at 0.4270
- On July 20th, the R^2 stood at 0.4363
Advertisement
