

Delaware, Hawaii, Rhode Island: #COVID19 vaccination rates by county & partisan lean
Thu, 05/27/2021 - 9:31pm
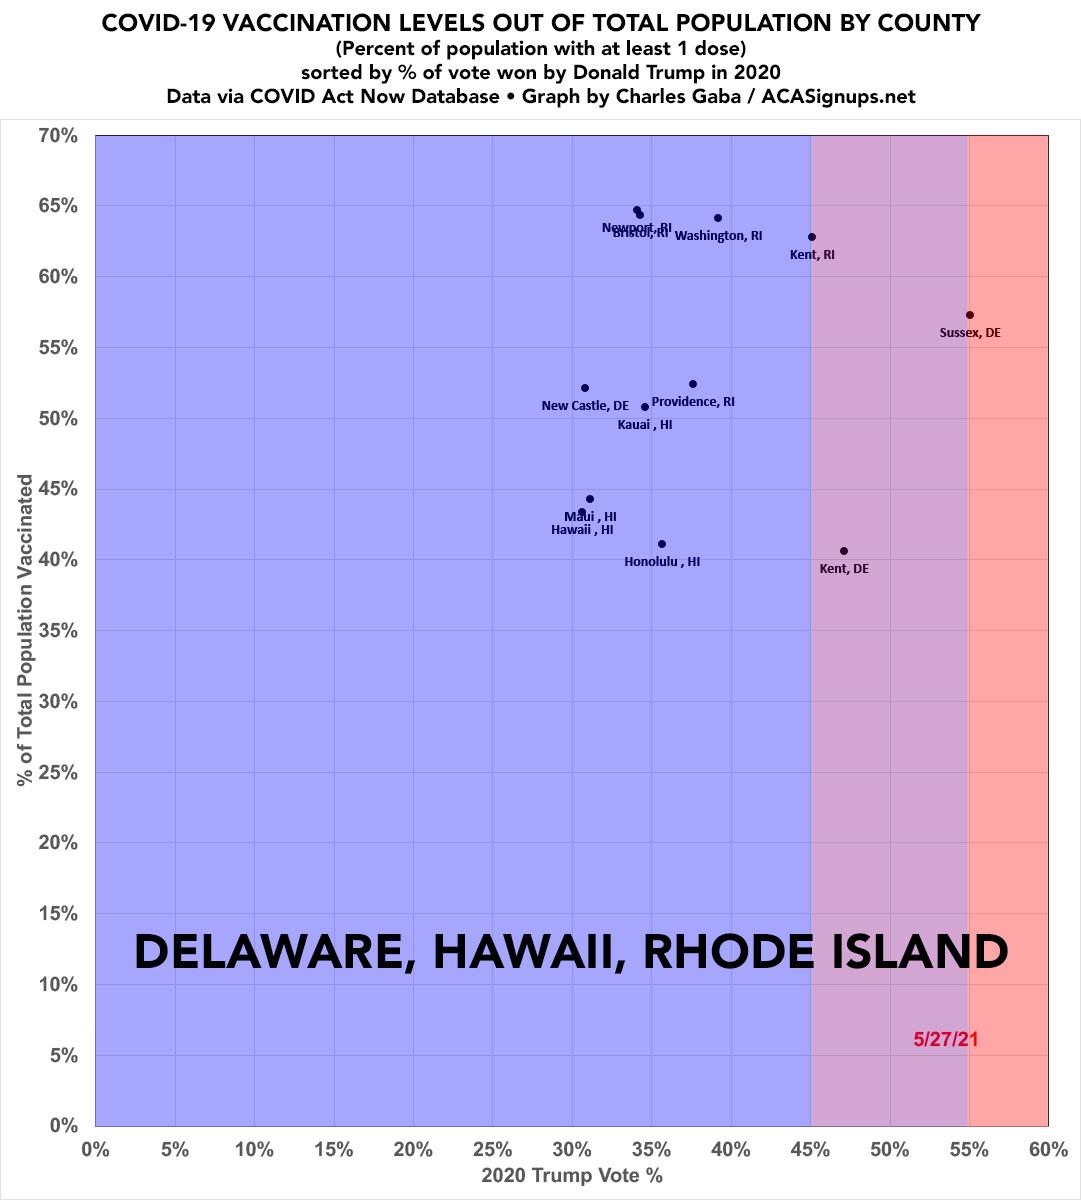
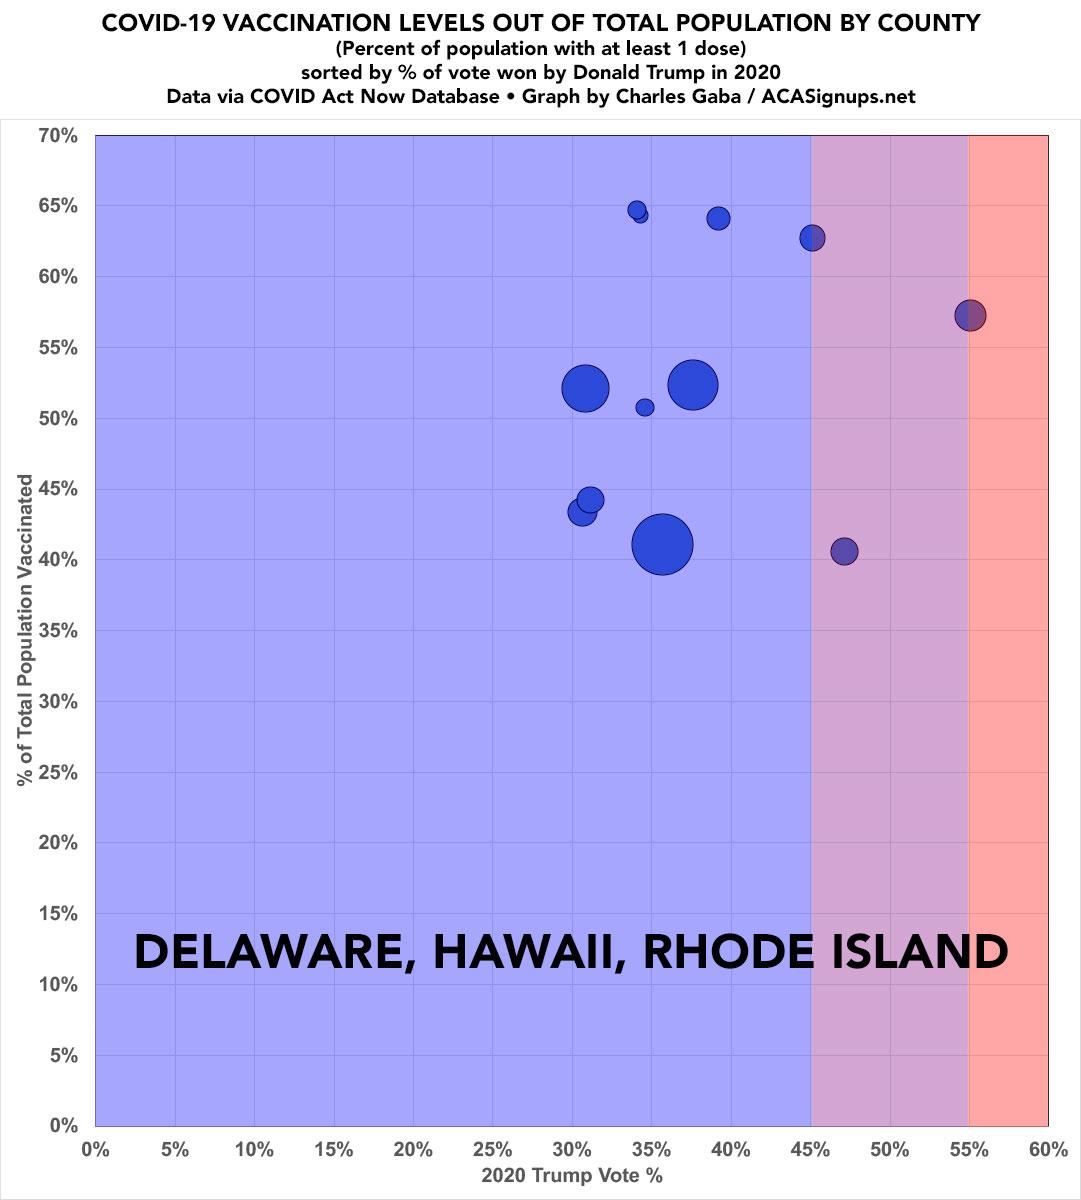
Now that I've developed a standardized format/layout & methodology for tracking both state- and county-level COVID vaccination levels by partisan lean (which can also be easily applied to other variables like education level, median income, population density, ethnicity, etc), I've started moving beyond my home state of Michigan.
Delaware, Hawaii and Rhode Island only have 3, 6 and 5 counties respectively, so it seemed a little silly to run separate graphs for each one (I was already pushing it by giving Connecticut (8 counties) its own entry). So...I've merged all three onto one graph.
It also seemed a bit disingenous to try and come to any conclusions about a trendline with these three states in particular, so I didn't bother (not that there's much to make of that anyway...every county in these states is running between 40 - 65% vaccinated, and within 30-55% Trump support...except for tiny Kalawao, Hawaii, which only has 86 residents (none of whom appear to have been vaccinated yet, according to the CDC?), which I didn't bother listing at all.
Anyway, I'm including them mostly for completeness sake.
- 2020 Presidential Election results via DE, HI & RI Secretary of State's office (thru Wikipedia)
- Vaccination data via COVID ACT Now database.
Advertisement
