

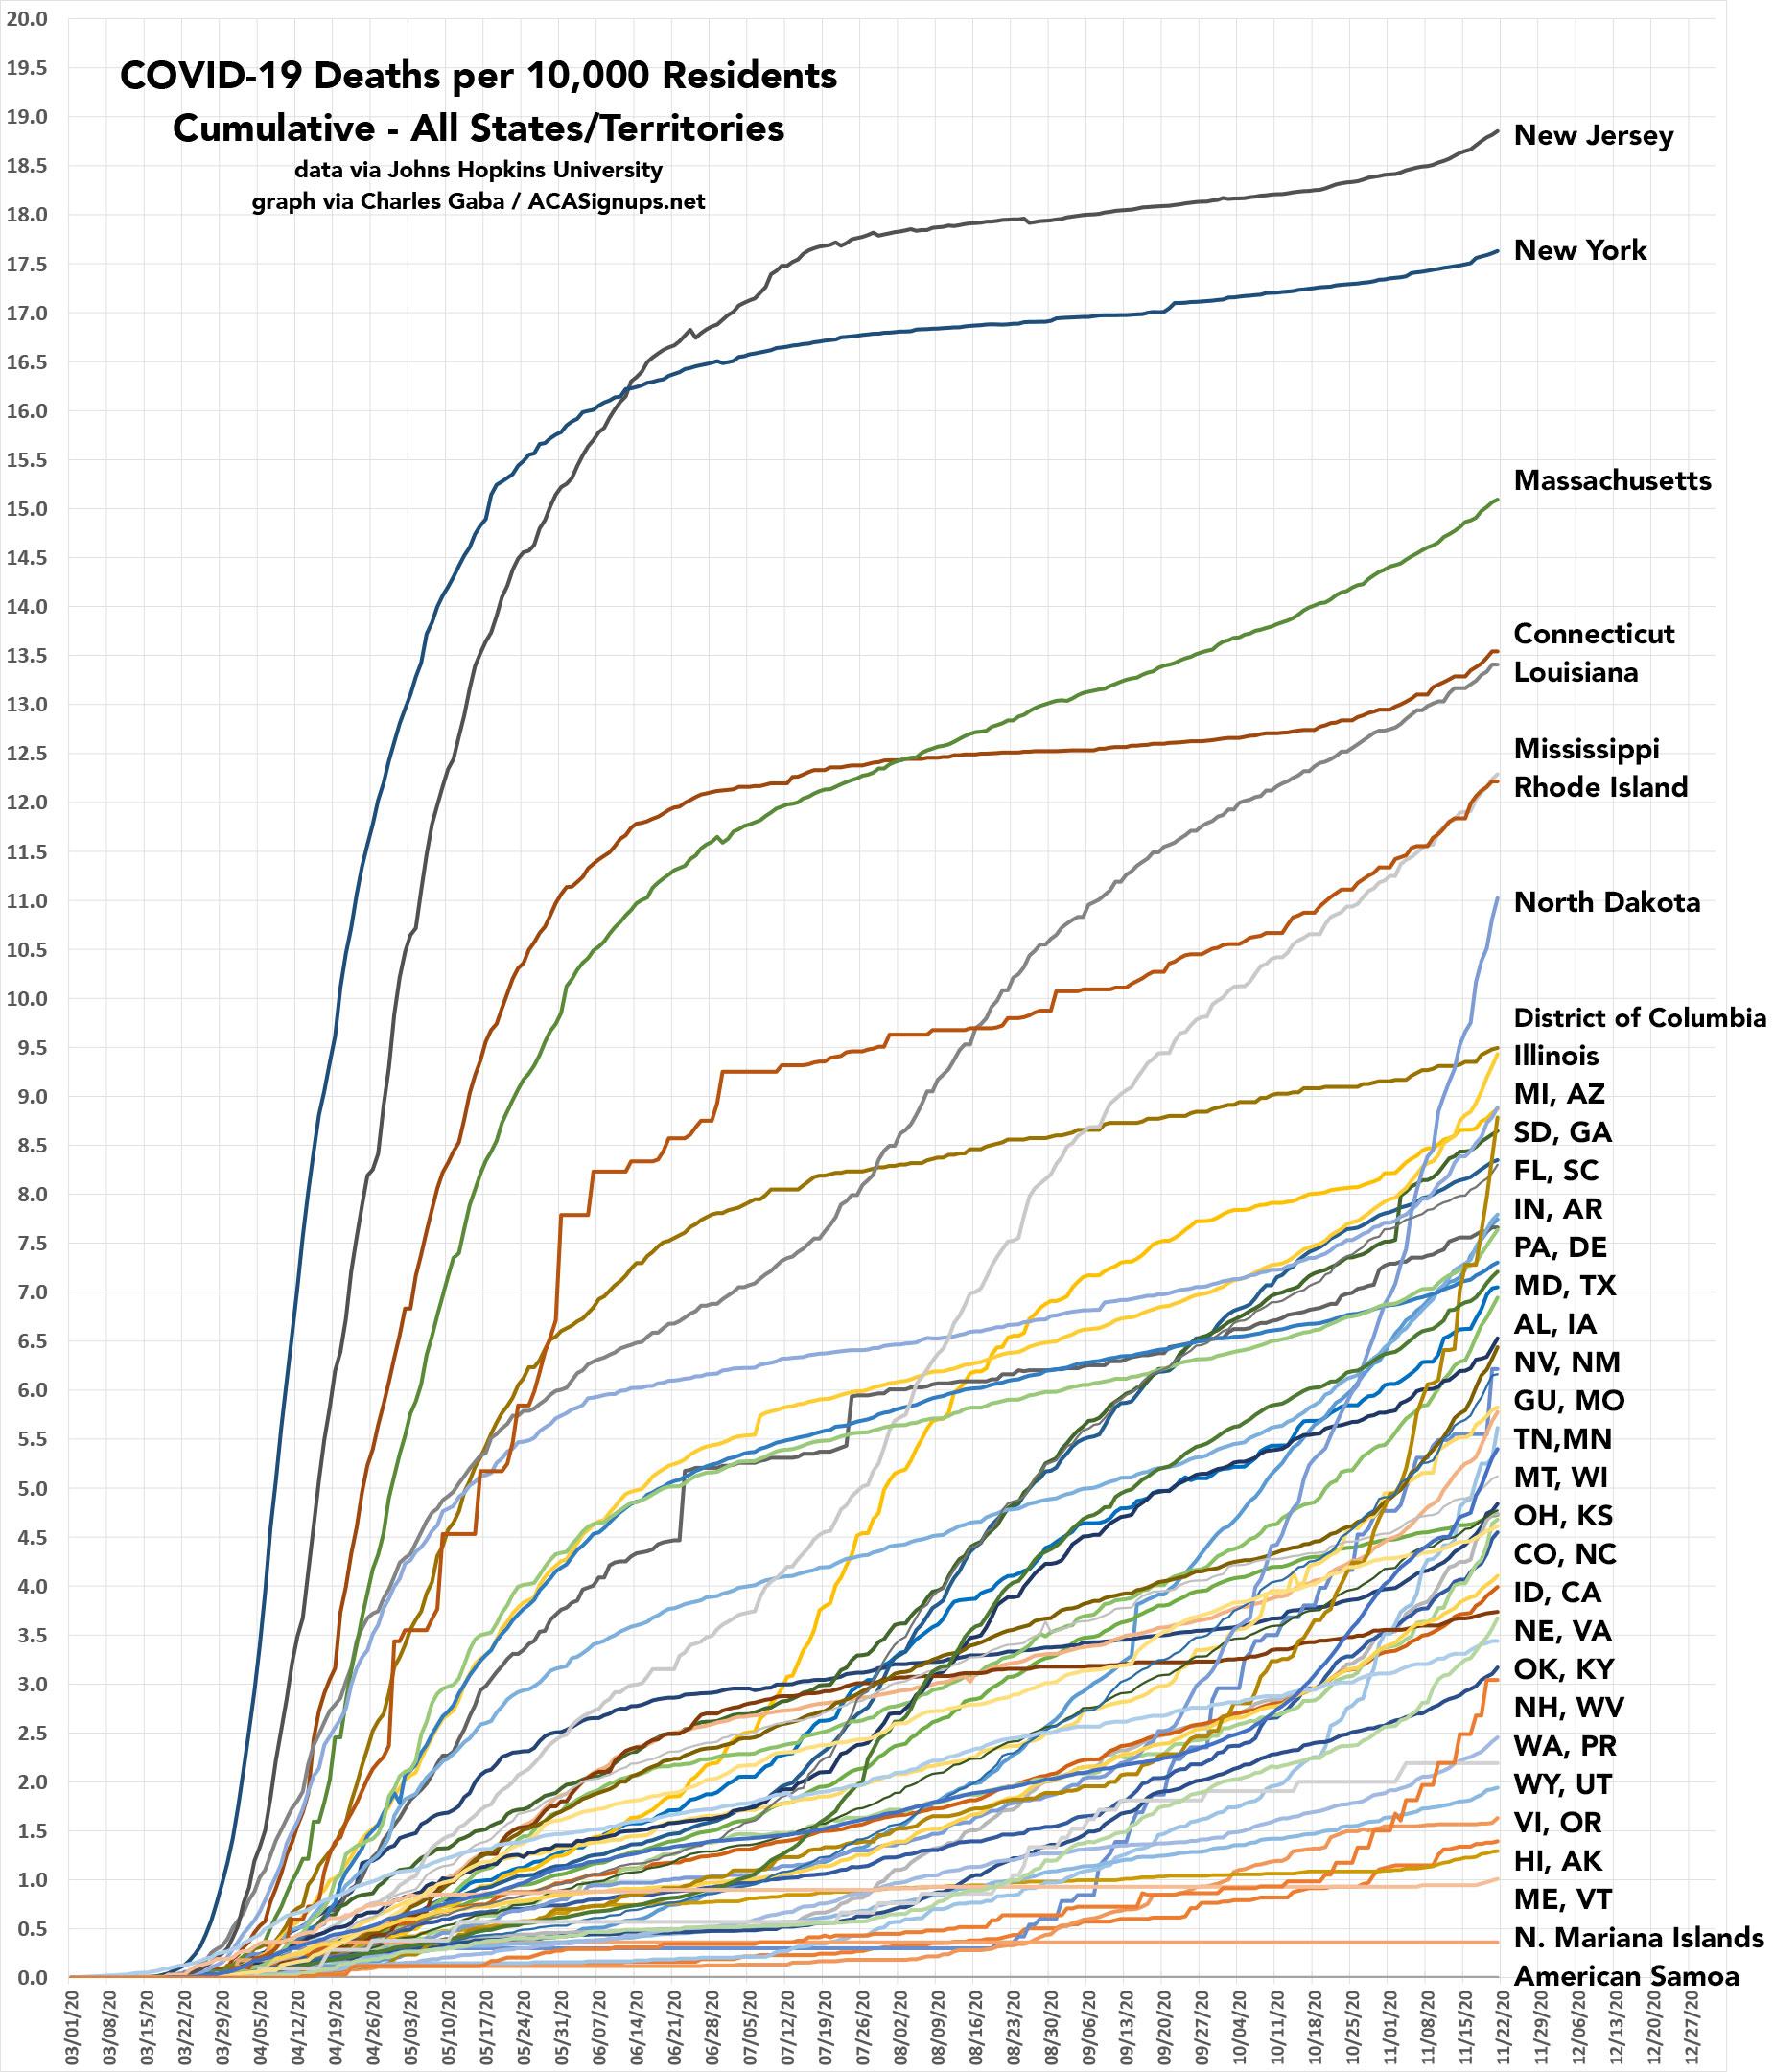
How #COVID19 *fatalities* have spread across every U.S. state & territory per capita over time
Tue, 11/24/2020 - 7:10pm
"Picture worth 1,000 words" and all that.
I was doing this earlier in the summer but stopped updating it in August; I've started over with a fresh spreadsheet and have expanded it to include every U.S. territory, including not just DC & Puerto Rico but also American Samoa, Guam, the U.S. Virgin Islands and even the Northern Mariana Islands.
I've done my best to label every state/territory, which obviously isn't easy to do for most of them given how tangled it gets in the middle. The most obvious point is that while New York and New Jersey are still far above every other state, other states are quickly catching up...and the trajectories of both North & South Dakota are incredibly disturbing in particular.
Advertisement
