

Week Five HC.gov Snapshot: Up from week 4 as expected, have reverted back to my original projections
Wed, 12/06/2017 - 8:34am
After being way off in my initial HC.gov projections the first and second weeks of the 2018 Open Enrollment Period, I recalibrated and was dead on target for Weeks 3 and 4: As of November 25th, just shy of 2.8 million people had selected Qualified Health Plans (QHPs) through the federal exchange.
As I had predicted, there were a bunch of eye-roll-inducing headlines about how enrollments had dropped off a cliff, etc etc, which completely ignored the fact that it was Thanksgiving week, and that a 35%+ drop-off is typical for the holiday weekend. Whatever.
For the post-Thanksgiving week, however, ACA enrollments typically roar back to life, and this year was no exception...although not by nearly as much as I was hoping:
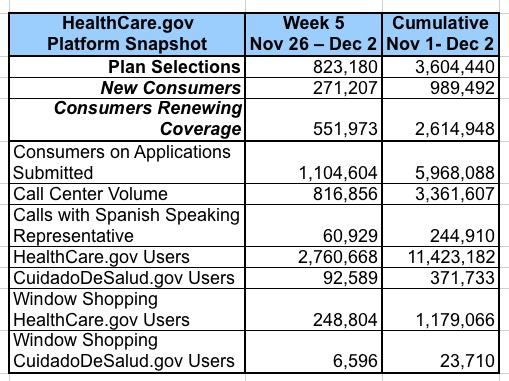
Erk. I was assuming around 1.2 million last week; instead it was only 823,000, which is only slightly ahead of the same week last year (see below). This brings the grand total to just over 3.6 million instead of the 4.0 million I was hoping for.
Still, the percentage of NEW enrollments continues to climb, and now stands at 27.4% overall. I can't run a true comparison with last year because they ran bi-weekly reports on the new enrollee percent, but it seems to be roughly the same.
Overall enrollments are up 22% over last year (3.6 million vs. 2.95 million). However, the weekly year over year breakout paints a less rosy picture:
- Week 1 ran 45% ahead of last year (601K vs. 416K), although that was only 4 days vs. 5
- Week 2 ran 48% ahead of last year (877K vs. 593K)
- Week 3 ran 16% ahead of last year (799K vs. 691K)
- Week 4 ran 15% ahead of last year (504K vs. 439K)
- Week 5 ran 2% ahead of last year (823Kvs. 810K)
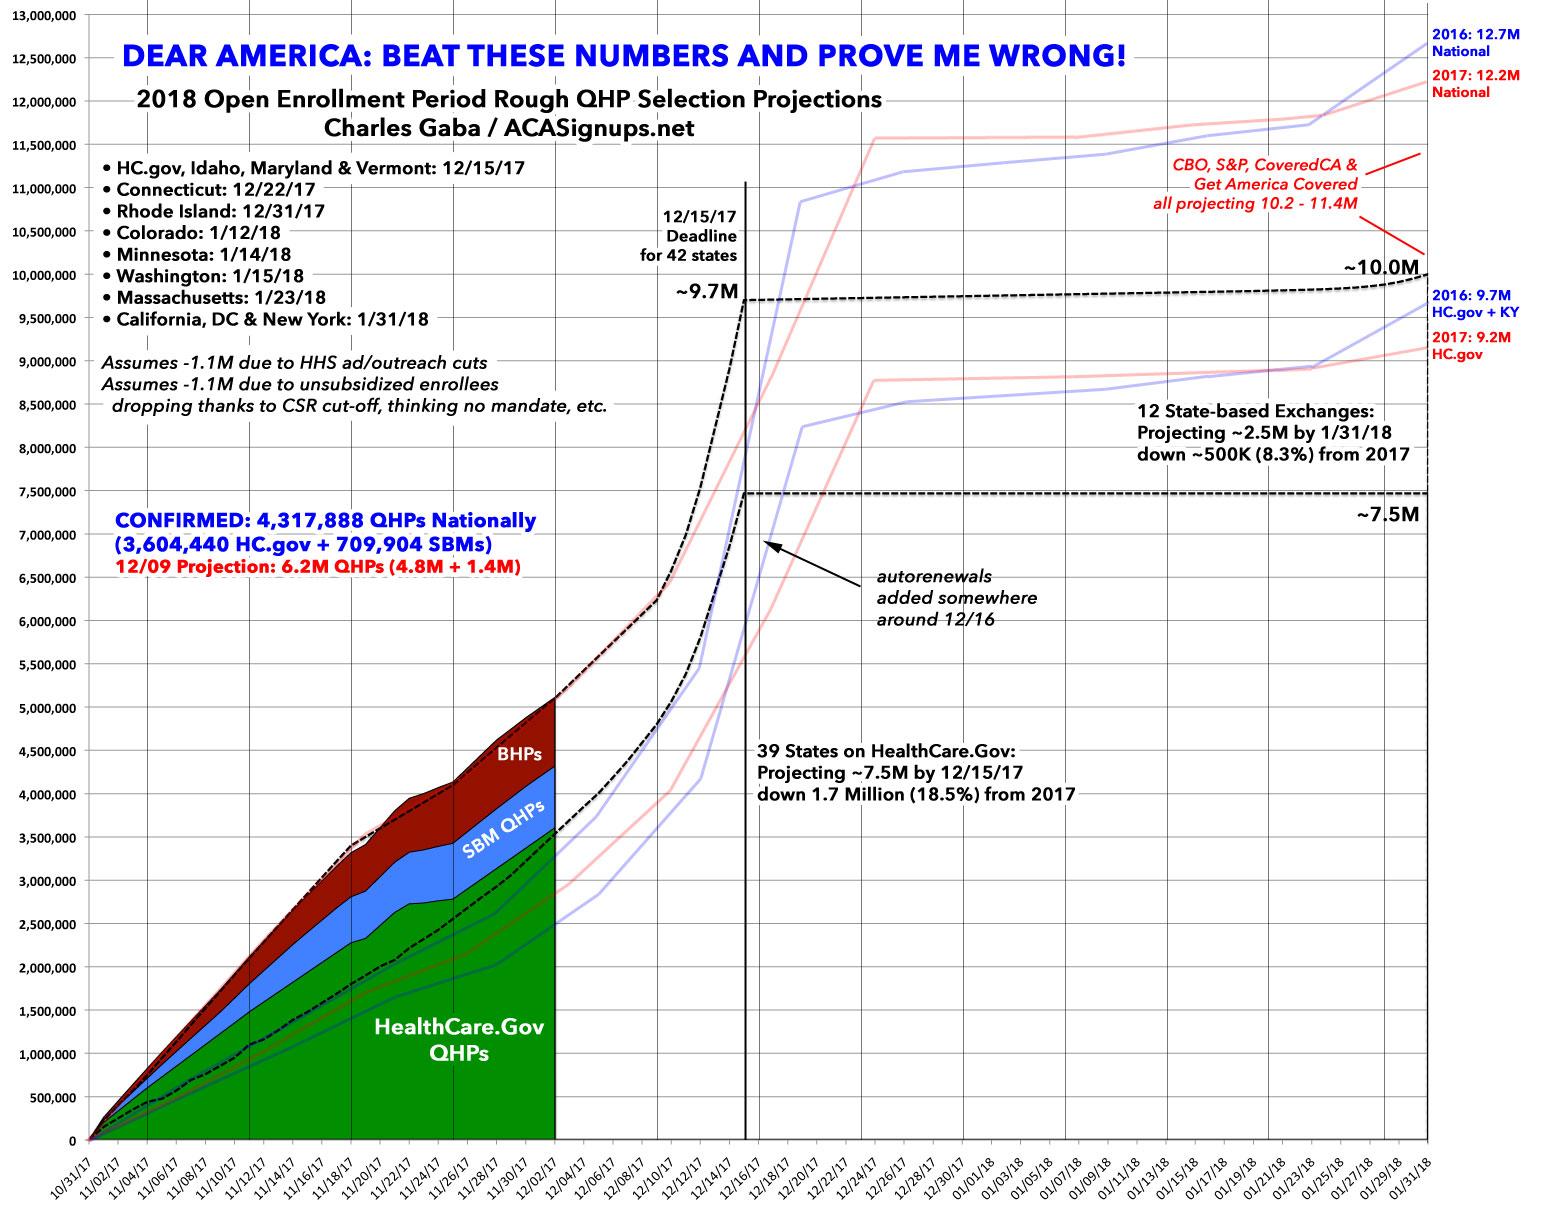
Nationally, there were 5.21 million QHP selections as of December 3rd last year. I'm missing a lot of SBM data, but I estimate another 1.8 million QHPs via the 12 SBM states through December 2nd this year; if so, that would give a grand total of 5.4 million.
Keep in mind that we're getting to the point where that "missing" extra day means a lot. A true apples-to-apples comparison would include December 3rd from last year...which means we'd likely have to tack on another 120,000+ to give a proper year over year comparison for HC.gov.
Here's the state breakdown for the 39 HC.gov states:
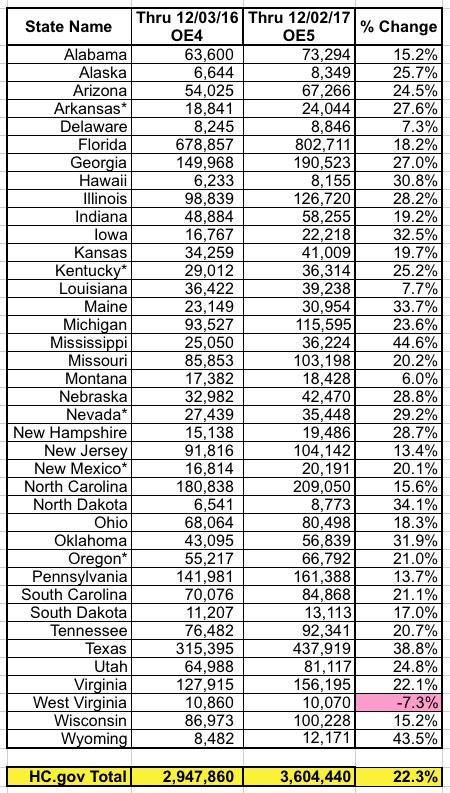
West Virginia continues to be an anomaly, now seeing a 7.3% drop year over year while every other state still runs significantly ahead of OE4 numbers:
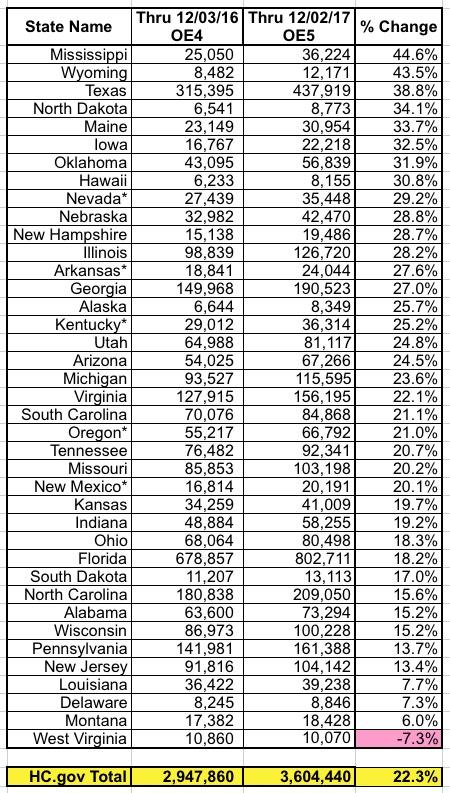
Mississippi has surpassed Wyoming as seeing the largest year over year increase percent increase.
So...what's next? Well, for starters, it's time to scrap my revised projections, since the actual number (for HC.gov at least) have reverted back to my original projections a week earlier than I expected. If nothing else, this helps clean up the graph a bit, anyway. I still expect HC.gov to hit around 4.8 million QHP selections by this Saturday (December 9th), with the 12 state-based exchanges tacking on another 1.4 million for a total of around 6.2 million nationally. After that comes the biggest unknown: The Final Week Surge.
Advertisement
