

Week Three HC.Gov Snapshot: Finally nailed it: 2.28 million QHP selections thru 1/18
Wed, 11/22/2017 - 10:05am
On the one hand, I nailed the Week Three HC.gov number almost perfectly (I projected 2.3 million, the actual number is 2,277,079). Yay, me! Only off by 1%! On the other hand, I seriously underestimated the first two weeks, so I'm not patting myself on the back too much. It's an insane year with too many unknowns for me to do much more than throw darts at the board. Still, I'll take credit where I can.
In addition, CMS has also started breaking the numbers out by state, which helps analysts look for trends and cause/effect relationships, so let's jump in!
First, the main numbers:
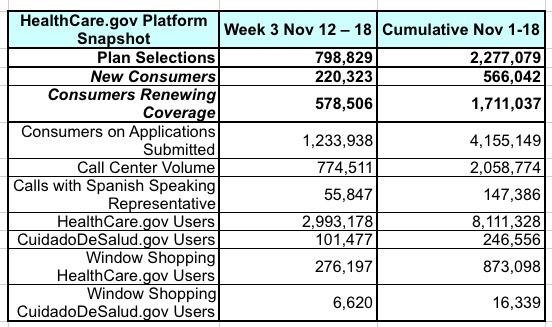
The portion of new enrollees continues to inch upwards, which is good: It's just shy of 25% of the total now. Last year HC.gov only released snapshot reports every two weeks, so I don't really have an apples-to-apples comparison of new enrollments since there was no Week 3 report, but in the 2016 Week 4 report, only 24.3% of enrollees were new, so that's a positive sign as well.
I do, however, have a Week 3 report for total enrollments (see state-level comparison table below), and they're up 34% year over year. Note, however, that last year inlcuded 19 days vs. 18 days this year. 114,118 people signed up between 11/12 - 11/18, but the 19th was a Sunday. Enrollment generally drop off over the weekend anyway, and HC.gov is offline for maintenance for part of the day on Sundays, so let's call it perhaps 60,000 more. That would give a grand total of 2.34 million through the 19th, or around 38% higher year over year.
OK, what else? Well, there's 4.2 million "consumers on applications submitted". This is the total number of people who have filled out their info but haven't actually selected a policy for 2018 yet. This is 7.6% higher than the number of applications submitted as of November 26th of last year, which, again, is a very positive sign.
OK, what about the state-level breakout?

Here's what it looks like relative to last year so far (I reordered the states to be alphabetical by name instead of by abbreviation):
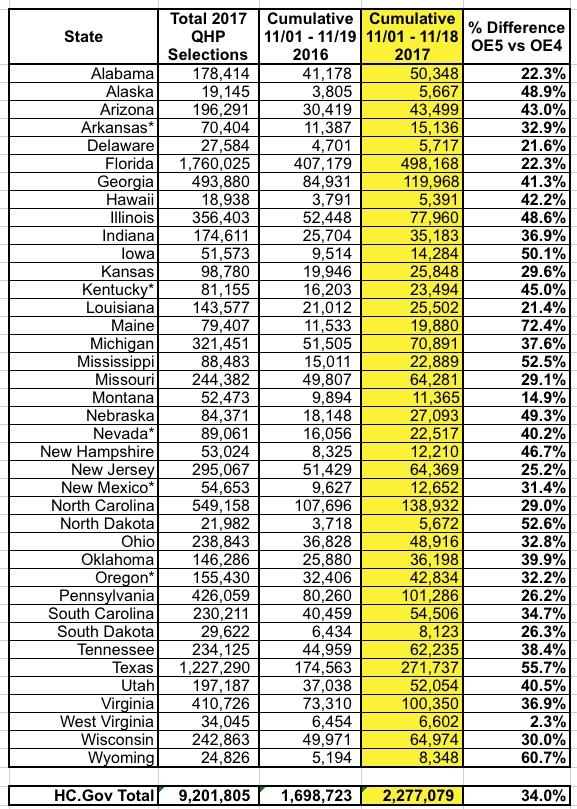
Overall, enrollments via HealthCare.Gov are up 34% year over year, but again, if you tack on another 60,000 or so to include the missing extra day, it's more like 38% higher.
This is a reduction from Week Two's 47% increase, which is pretty much what I was expecting to happen around this point.
More interesting to me is which states are kicking ass relative to last year. Every state is up somewhat, but some are doing better than others. When I sort them by % change year over year, it looks like this:
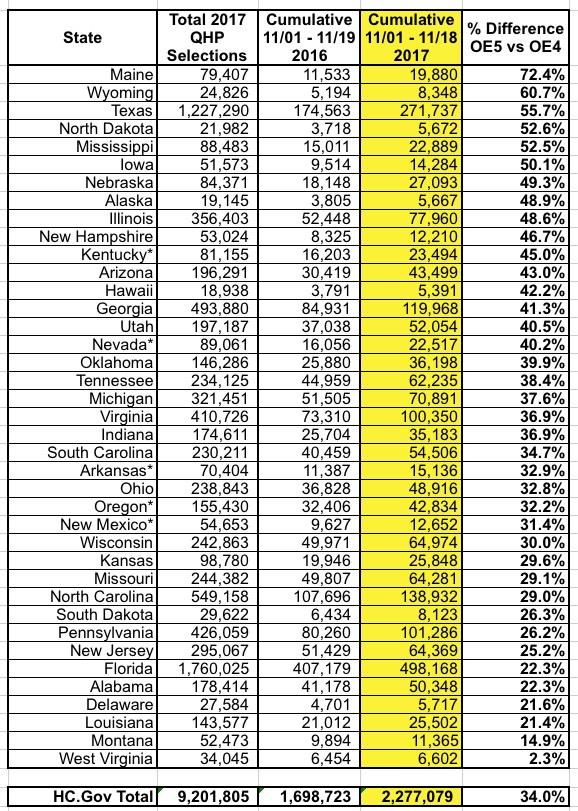
Obviously this could change over the rest of the enrollment period, and the auto-renewals will skew things further, but so far, Maine is an astonishing 72% ahead of last year (hello, Senator Collins!), while West Virginia is barely ahead.
Something else I find interesting: Wyoming is up 60% so far even though their unsubsidized 2018 premiums are the highest in the country...lots of Silver Loading going on?
Also noteworthy: Wyoming, Texas, North Dakota, Mississippi and Iowa...red states across the board (OK, perhaps not Iowa?) are all up more than 50% over last year. Huh.
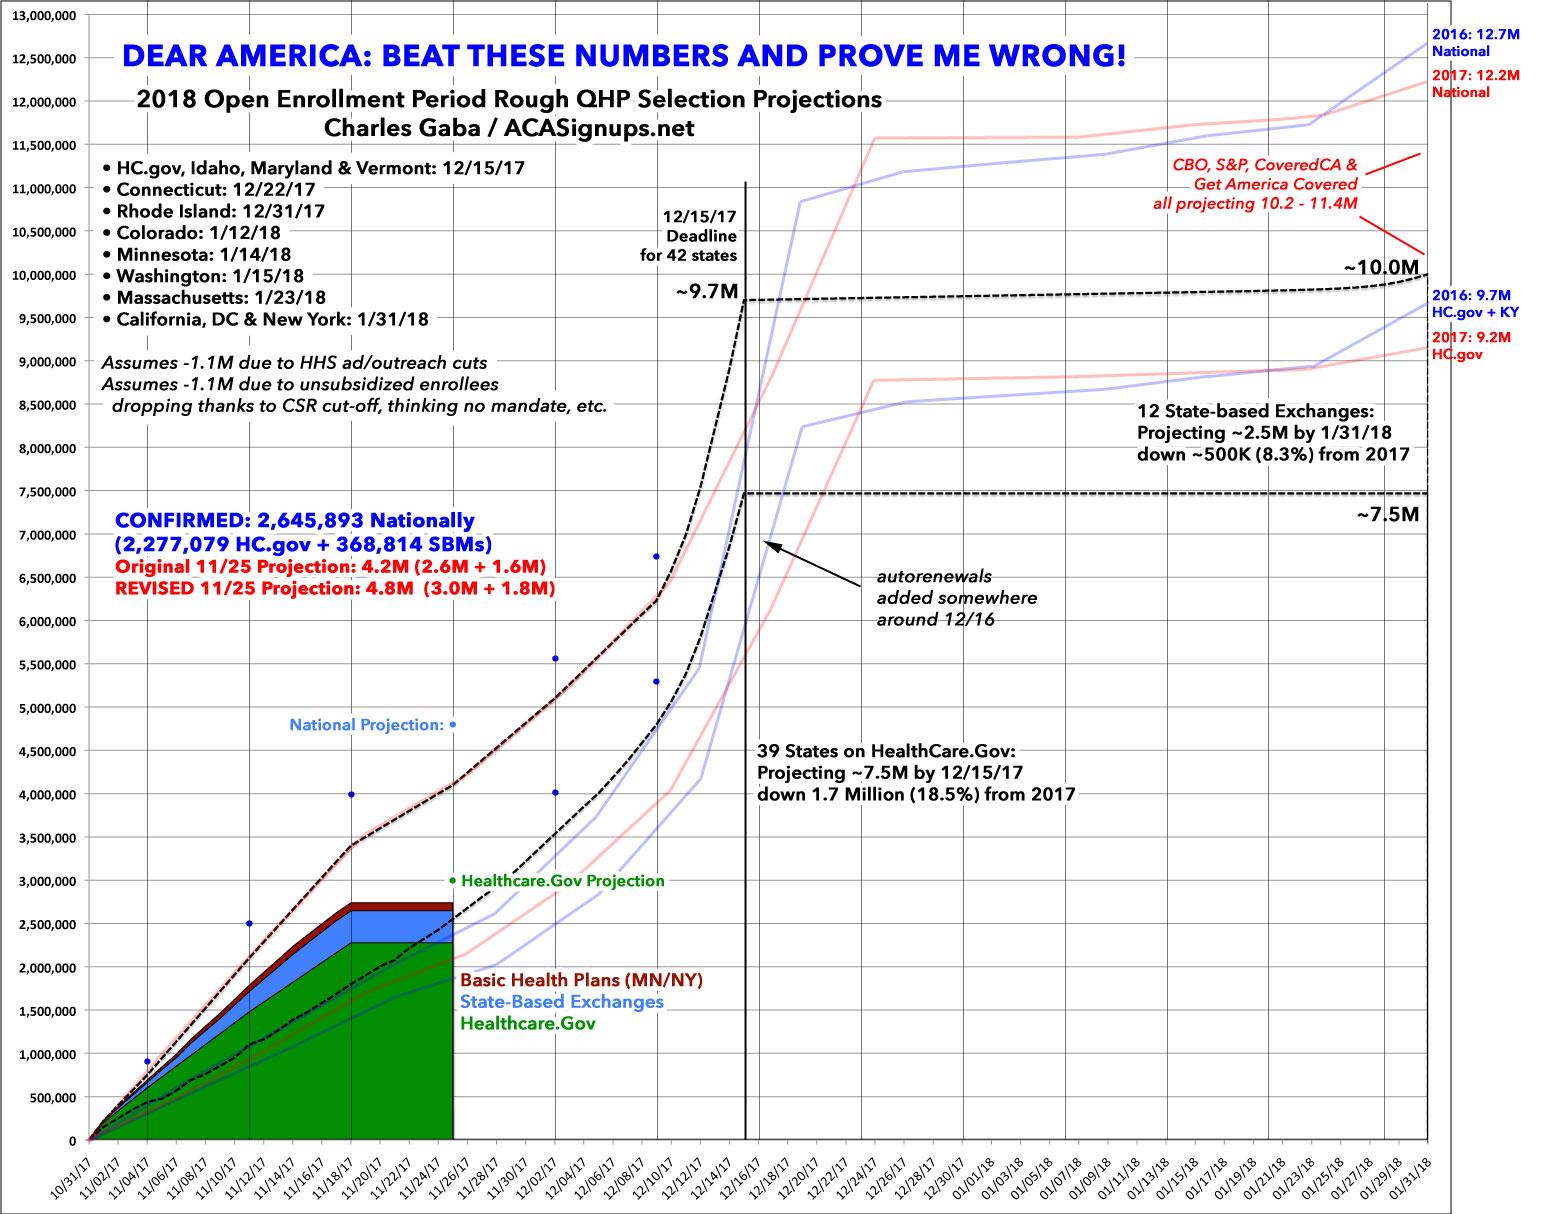
In any event, here's my best estimate of the state-level breakout of new enrollees vs. renewals, including the known data from the 12 state-based exchanges:

For Week Four (11/25), I'm projecting around 3.0 million QHPs via HealthCare.Gov, plus another 1.8 million via the 12 state exchanges, for a total of around 4.8 million.
Advertisement
