

A visual guide to why early enrollment numbers can be deceiving
Fri, 11/10/2017 - 9:53am
At first glance, the graph below strongly resembles the Pictured Rocks National Lakeshore attraction in Munising, Michigan, which my family visited over the summer. It's truly gorgeous.
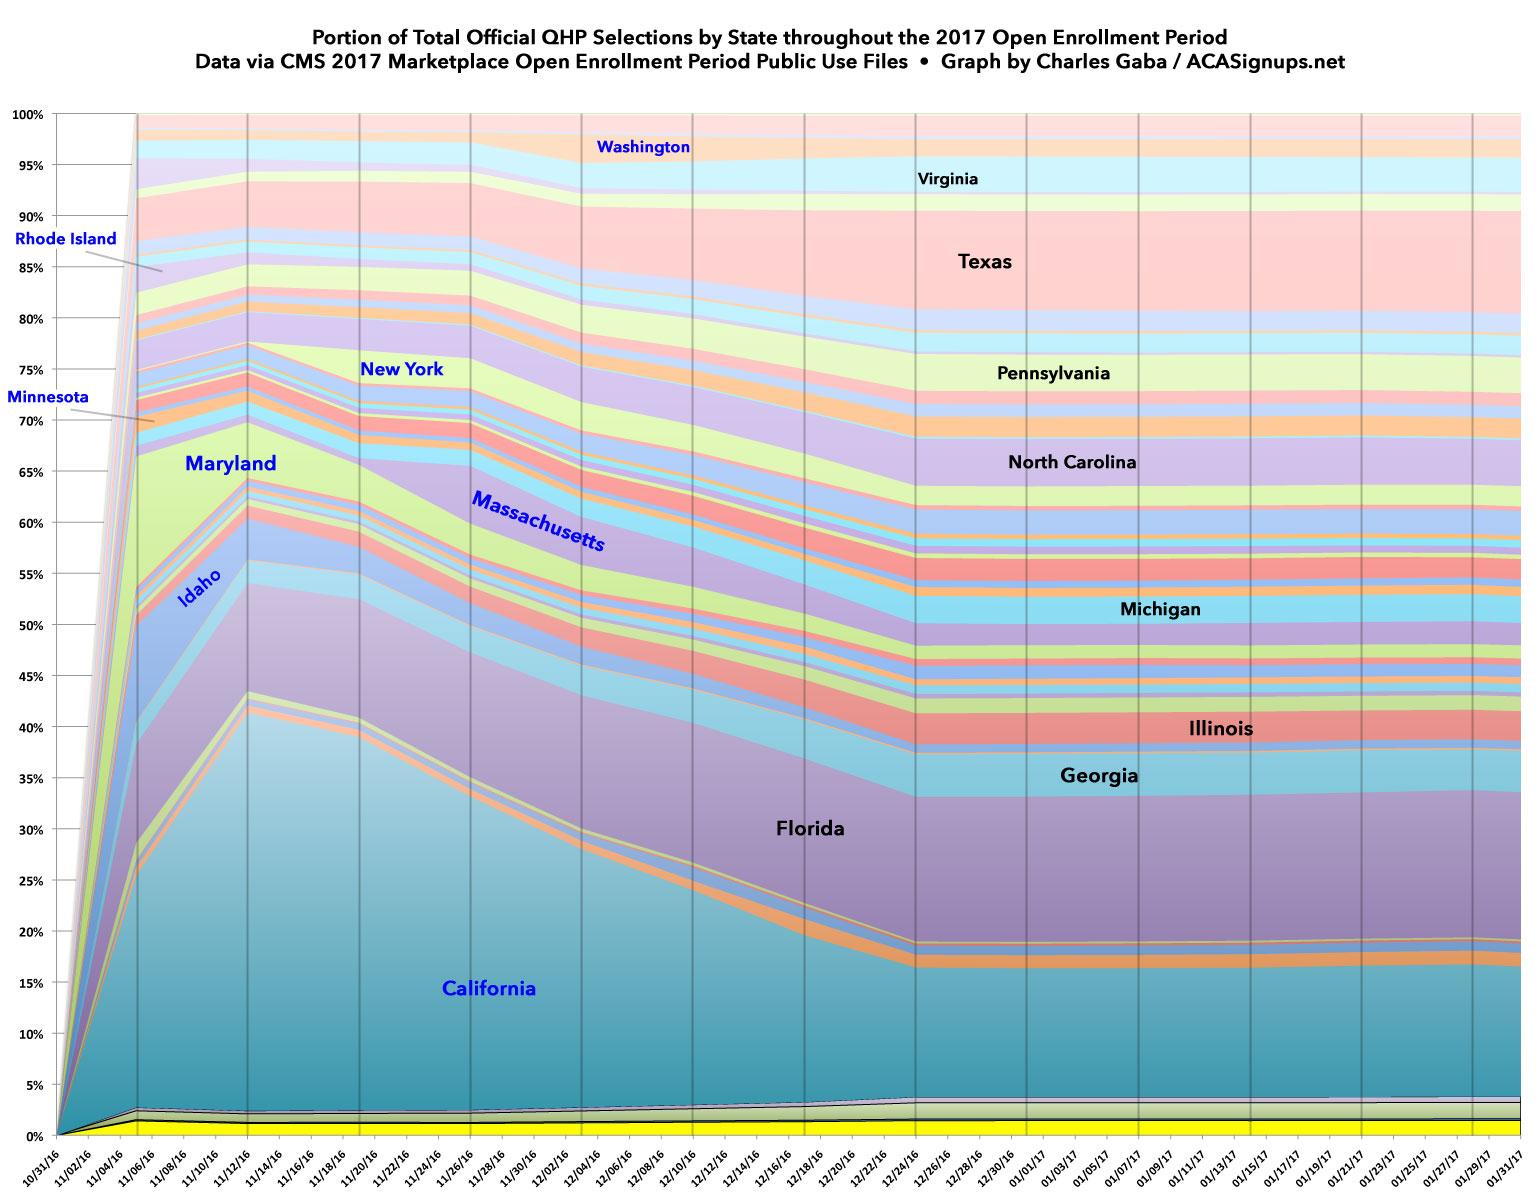
However, what you're looking at is, in fact, a visual breakout of the state-by-state proportions of total Qualified Health Plan selections on the ACA exchange throughout the 2017 Open Enrollment Period, which ran from Nov. 1, 2016 - Jan. 31, 2017. The data comes from the official Public Use Files from the Centers for Medicare and Medicaid. As you can see, most states follow a fairly obvious trend because 39 of them are run through the federal exchange at HealthCare.Gov.
Since all 39 are administered, entered into the system and reported the same way, the only variances between them are their relative population size: Large states are thicker, small states are thinner throughout the entire enrollment period as you'd expect.
HOWEVER, there are 12 states (including two of the largest, California and New York) which operate their own ACA exchanges...and some of them handle their enrollment order, process and reporting quite differently from the rest of the country. This results in some skewing of the numbers early on, making drawing early conclusions difficult.
In addition, remember that for 2017, the Open Enrollment Period was a full 3 months for all 50 states (+DC). A few may have had slightly later interim deadlines (December 23rd for January coverage instead of December 15th, for instance), but otherwise their end dates were pretty much the same. In 2018, however, 42 states have their final deadline on December 15th...but the remaining 9 states have extended their deadlines anywhere from one to six weeks later, with California, New York and DC maintaining the prior Jan. 31st cut-off. This makes predicting the overall flow of 2018 enrollments even more difficult, since there's always a final enrollment surge just ahead of the deadline for every state.
The states are in reverse alphabetical order. Most of the areas are too thin to label easily, but I've added state names to eight of the larger HC.gov-based ones to give a sense of proportion. I've also labelled eight of the state-based exchanges in blue. The missing four (CO, CT, DC & VT) are either too small to see or follow the same reporting pattern as HC.gov, so aren't really relevant here.
The blue state exchanges each have something unusual going on which distorts the first half of the graph:
- Most obviously, California is the single largest state-based exchange. Unlike most other states, they opened up their "Plan Preview/Window Shopping" tool way back on Oct. 11th, and also have an expediated renewal/re-enrollment process for current enrollees which allows them to select a new plan (or renew their existing one) very quickly, leading to an early surge in their portion of the national total. Unfortunately, CoveredCA also has an annoying policy of not publicly reporting re-enrollments of any sort until much later in the year. That means that even though they've only REPORTED 6,000 enrollments for the first day this year, they actually likely enrolled well over 220,000. For comparison, last year they surprised me by reporting both numbers in their 15-day tally: 263K renewals + 45K new, or 308,000 in the first 15 days. It's safe to assume that a similar pattern is holding this year.
Since CA strongly encourages people to actively re-enroll, they tend to have a much smaller proportion of auto-renewals left to add in later on, while current enrollees in most states re-enroll at a more leisurely pace, gradually eating away at California's portion of the national total.
- Idaho, Maryland and Rhode Island, meanwhile, took an even more front-loaded approach: They auto-renewed all current enrollees up front, and then removed them from the tally as time goes on. This means that all three states start things out with a disproportionately large chunk of the national total, which again is then quickly shrunk down to size as the rest of the country starts to catch up. I know that Rhode Island is doing the same thing this year; not sure about Maryland and Idaho, but if Maryland is doing so they appear to be doing the same thing as CA: Reporting new enrollments only for now, not renewals.
- Massachusetts appears to have done something similar, but not until three weeks in. This meant they held a thin slice the first few weeks which then ballooned into a bigger chunk in late November before gradually shrinking again. I think Washington State follows the same pattern, although not until a week later.
- New York, meanwhile, takes the exact opposite approach to California: Current enrollees can't start renewing their policies until AFTER Nov. 15th. That means they have tiny numbers of new enrollees only the first two weeks which then balloon out starting in Week Three. Of course, NY's numbers are much smaller than their total population would suggest due to the Essential Plan (BHP) program cannibalizing most of their exchange enrollees.
- That leaves Minnesota. It doesn't look that dramatic due to the relatively small size of their population, but Minnesota took off like a rocket early on last year. Why? Because of an unusual arrangement with the various carriers on the exchange. MNsure agreed to put an enrollment cap on four of the five carriers on a first come, first serve basis. This led to a huge rush in the early days, at a rate 6 times faster than the previous year. Once those limits were maxed out, however (BCBS was the odd man out allowing everyone else to enroll), things dropped off to normal rates.
The point of all this is that yes, it's extremely encouraging to see such a massive groundswell of enrollees in the first week, and yes, this suggests that the final totals will likely be better than my initial, gloomy 10M total projection (~7.5M on HC.gov, ~2.5M on the state exchanges)...but there's still way too much noise in the early few weeks to get a sense of where things are headed. I hope my projections end up laughably pessimistic, believe me, however.
Advertisement
