

CBO issues new 10-year Healthcare/Insurance Coverage Projection
Thu, 09/14/2017 - 4:55pm
Well this was unexpected, although I suppose I should have expected it given all the insanity surrounding the impending deadlines for insurance carriers to sign contracts (Sept. 27th, I believe); the end of the fiscal year on Sept. 30th (which is also the last chance for the GOP to try and squeeze through the hideous Cassidy-Graham Hail Mary repeal/replace bill); and the start of Open Enrollment on November 1st.
The CBO has issued a 17-page report with their latest projections for the types of healthcare coverage and federal spending on healthcare programs including Medicaid, CHIP, ACA tax credits and so forth over the next decade. here's what they foresee:
The federal government subsidizes health insurance for most Americans through a variety of programs and tax provisions. In 2017, net subsidies for people under age 65 will total $705 billion, CBO and the staff of the Joint Committee on Taxation (JCT) estimate.
In order to project the future cost to the federal government of providing those subsidies, CBO and JCT have projected the number of people under age 65 with health insurance of various kinds. They have then projected the federal costs associated with each kind of subsidy under current law, including the cost of preferential tax treatment for employment-based coverage, the cost of providing Medicaid coverage to people under age 65, and the size of government payments for other kinds of health insurance coverage—such as plans purchased through the marketplaces established under the Affordable Care Act (ACA). (The government also bears significant costs for health insurance for people age 65 or older, mostly through Medicare and Medicaid, as CBO has reported elsewhere.)
It's important to note that seniors are handled via a completely separate report, which is why the Medicaid number only totals 63 million even though there's actually around 74 million in Medicaid total; the other 11 million are "dual-eligible" senior citizens, enrolled in both Medicare and Medicaid. Under-65 Medicare, meanwhile, is only pegged at 8 million; this mostly includes long-term Social Security Disability Insurance enrollees and those with ALS or ESRF.
CBO has used these new estimates to adjust its current baseline budget projections, which incorporate the assumption that current law generally remains in place. Specifically, CBO has updated its baseline projections of the federal cost of subsidizing health insurance purchased through the marketplaces, of spending to subsidize insurance provided through the Basic Health Program, and of net spending and revenues associated with stabilizing premiums for insurance purchased by individuals and small employers. Because of the extensive work required to analyze pending legislation over the past eight months, CBO and JCT did not have time to prepare these new estimates before CBO published the most recent report about its baseline budget projections for the federal budget as a whole in June 2017.
CBO’s most recent report comparable to this one was published in March 2016; it described the projections underlying CBO’s March 2016 baseline. For 2026, the agencies’ projection of the number of people obtaining subsidized coverage through the marketplaces is now 4 million smaller, and the projected number of uninsured people is now 3 million larger, than they were in CBO’s March 2016 baseline projections. The projection of net federal subsidies for health insurance from 2017 to 2026 is $88 billion lower. The largest contributor to that decrease involves subsidies for nongroup coverage (that is, insurance purchased individually) and the Basic Health Program, which are now projected to cost $137 billion less than the agencies projected in March 2016.
Remember all the griping and complaining over the summer by Sen. Ron Johnson and other Republicans back in June/July over the CBO relying on March 2016 budget projections instead of the more-recent January 2017 estimates? As you may recall, the whole reason the CBO used the earlier numbers is because they were specifically instructed to do so by Speaker of the House Paul Ryan...and once they started running their reports using that baseline, CBO policy is apparently to use it for all subsequent reports related to the first one (I'm not sure if that goes by fiscal year, legislative session or what).
Anyway, this is the CBO's brand new version of this projection report.
How Many People Under Age 65 Are Projected to Have Health Insurance?
According to CBO and JCT’s estimates, a monthly average of about 244 million noninstitutionalized civilians under age 65 will have health insurance in 2017. Almost two-thirds of them will have coverage through an employer, and about a quarter will be enrolled in Medicaid or the Children’s Health Insurance Program (CHIP). A smaller number will have nongroup coverage, coverage that is provided by Medicare, or coverage obtained from various other sources. On average, about 28 million people—10 percent of all noninstitutionalized civilians younger than 65—will be uninsured in 2017, CBO and JCT estimate (see figure below). Between 2017 and 2018, the number of uninsured people rises by 2 million in the agencies’ projections, mainly because premiums in the nongroup market are expected to be higher.
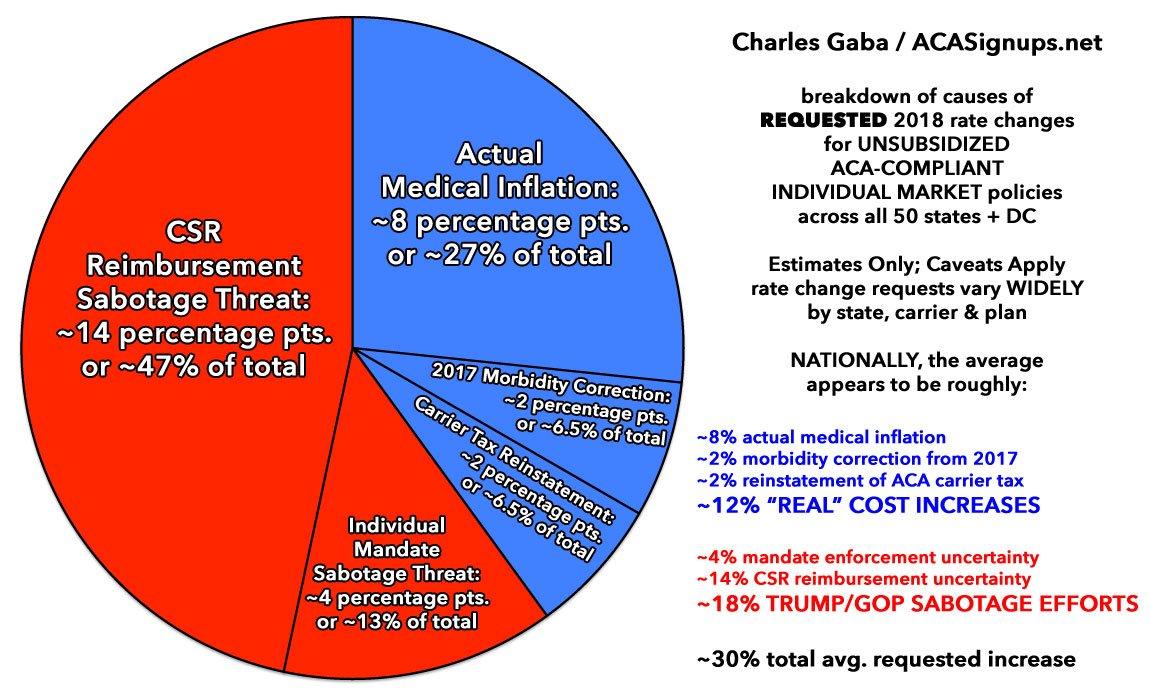
Yes, premiums are indeed expected to be higher...and a good 60% of that increase is directly connected to Donald Trump, Tom Price and the Congressional GOP's refusal to formally appropriate CSR reimbursement payments and, to a lesser extent, to Trump/Price putting out the word that they have no intention of enforcing the ACA's individual mandate penalty.
If you assign a 1:1 ratio between unsubsidized rate increases and the number of people expected to lose coverage next year specifically, you could argue that around 800K will be forced to drop coverage due to the "real" rate increases (ie., actual medical inflation, the reinstatement of the carrier tax, etc)...but the other 1.2 million would be due specifically to Trump/GOP sabotage of the CSRs and mandate penalty enforcement. That's not quite how it works, of course, but it gives a rough idea of how much of an impact those factors are.
From 2018 through 2027, the number of people with coverage is expected to grow from 242 million to 247 million. But the number of uninsured people is also expected to grow, from 30 million to 31 million, keeping the uninsured share of the under-65 population stable at 11 percent.
How Large Are the Projected Federal Subsidies, Taxes, and Penalties Associated With Health Insurance?
CBO and JCT currently estimate that in 2017, the federal subsidies, taxes, and penalties associated with health insurance coverage for people under age 65 will result in a net subsidy from the federal government of $705 billion, which would be equal to 3.7 percent of gross domestic product. That amount is projected to rise at an average annual rate of 5.0 percent between 2017 and 2027, reaching $1.2 trillion (or 4.1 percent of gross domestic product) in 2027. For the entire 2018–2027 period, the projected net subsidy is $9.2 trillion. Two types of costs account for most of that amount:
- Federal spending for people under age 65 with full Medicaid and CHIP benefits (excluding people who reside in a nursing home or other institution) is projected to amount to $4.0 trillion. That amount includes $1.0 trillion for people who would be made eligible for Medicaid by the ACA.
- Federal subsidies of work-related coverage for people under age 65, which stem mainly from the exclusion of most premiums for such coverage from income and payroll taxes, are projected to equal $3.9 trillion.
Put another way, the half of the country with employee-sponsored insurance will receive an average of $390 billion per year in subsidized healthcare.
Other projected subsidy costs are smaller:
- Medicare benefits for noninstitutionalized beneficiaries under age 65 (net of their premium payments and other offsetting receipts) are projected to amount to $1.0 trillion. Such spending is primarily for people who are disabled.
- Subsidies for coverage obtained through the marketplaces or through the Basic Health Program are estimated to total $0.8 trillion.
i.e., an average of $80 billion per year for ACA subsidies (APTC, CSRs and BHP funding).
In the agencies’ projections, the costs of the subsidies are offset to a small extent, $0.5 trillion, by taxes and penalties collected from health insurance providers, uninsured people, and employers.
How Stable Is the Nongroup Health Insurance Market Projected to Be?
CBO and JCT expect the nongroup health insurance market to be stable in most areas of the country. Preliminary data for 2018 show that insurers will offer coverage in all or almost all areas. Although premiums have been increasing, most subsidized enrollees buying health insurance through the marketplaces are insulated from those increases because their out-of-pocket payments for premiums are based on a percentage of their income; the federal government pays the difference between that percentage and the premium for a benchmark plan. (A benchmark plan is the second-lowest-cost silver plan in an area; a silver plan, in turn, is one that pays an average of 70 percent of the costs of covered health care services to certain beneficiaries.) Those subsidies—combined with the effects of the individual mandate, which requires most people to have insurance or pay a penalty, and other factors—are anticipated to result in demand for insurance by enough people, including people with low health care expenditures, that the number of insurers in the marketplaces would stabilize and insurers would be willing to sell nongroup policies in almost all areas of the country throughout the next decade.
What Are Premiums in the Nongroup Health Insurance Market Projected to Be?
CBO and JCT expect premiums for benchmark plans—which are the basis for determining subsidies—to increase by an average of 5 percent per year between 2017 and 2027. In 2018, the agencies project, the average benchmark premium will be roughly 15 percent higher than it was in 2017, largely because of short-term market uncertainty—in particular, insurers’ uncertainty about whether federal funding for certain subsidies that are currently available will continue to be provided—and an increase in the percentage of the population living in areas with only one insurer in the marketplace. Following the laws that govern the construction of its baseline, CBO has included funding for those subsidies in its baseline projections. Because of the assumed continuation of those payments, the agencies project that insurers’ uncertainty about the payments would be resolved before 2019 and that insurers would set 2019 premiums at levels that are not affected by similar uncertainty. As a result, the projected average premiums for benchmark plans are slightly lower in 2019 than in 2018.
The CBO is actually more optimistic than I am on this front. The pie chart above represents the requested average rate increases; I'm currently projecting the approved rate hikes to average somewhere around 25% or so, although the effective average will probably be a few points lower by the time the dust settles next spring; perhaps 22% overall, mainly due to people downgrading their policies (Gold > Silver, Silver > Bronze). The CBO thinks it'll only be around 15% on average, although they're referring specifically to benchmark Silver plans only, which make up over half the enrollments on the individual market.
I'll have more to say about the report itself later on this evening.
Advertisement
