

UPDATE: Monthly ACA Exchange Effectuation, 2013-2017
Wed, 06/14/2017 - 11:18am
A couple of days ago, Trump's CMS division of the HHS Dept. released a Q1 2017 ACA exchange effectuation report. This should have been of mild interest to data geeks like me but not especially controversial...except that, as I noted at the time, they played fast & loose with which enrollment/payment data they did and didn't include. As a result, the report made it look like post-open enrollment attrition was dramatically worse in the first quarter of 2017 than it was in previous years. Instead, when you match up the data to match prior years, it looks like the retention rate as of March is actually pretty much exactly the same, or potentially even slightly better.
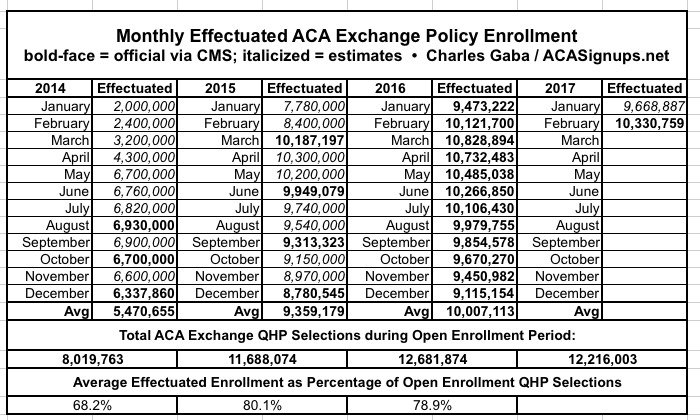
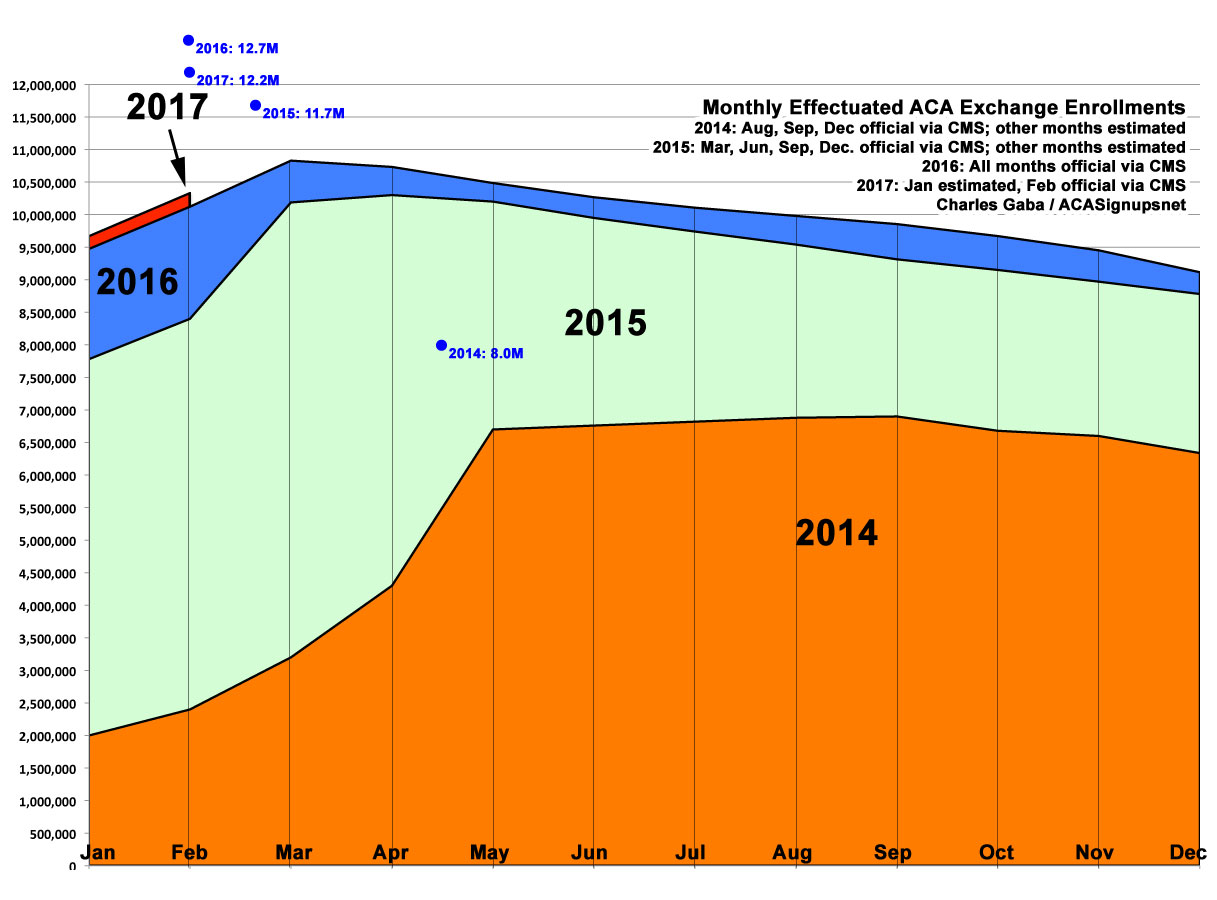
However, this does raise the question of just what sort of retention/attrition rate is (or should be) normal in the individual market. I've therefore cobbled together the hard data I have for month-to-month effectuation data from CMS, along with my own estimates based on enrollment and payment trends, to come up with the following chart that compares monthly effectuation in exchange policies across all 4 years: 2014, 2015, 2016, and the first two months (not three!) of 2017. The numbers are below, followed by the graph:
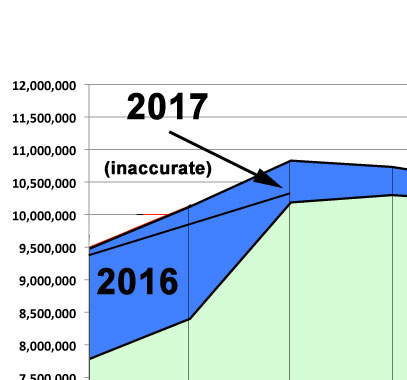
Here's what the CMS report tried to make it look like:
In 2014, effectuations didn't ramp up and peak until around May, because of the 6-month official enrollment period and the fact that the massive technical problems at launch in October 2013 caused OE1 enrollment to be massively back-loaded, requiring an extra 2-week "overtime" period to be tacked onto the end. As a result, OE1 didn't officially end until April 15. Since enrollees who sign up in the first half of the month aren't actually effectuated until the first day of the following month, that meant a huge jump in effectuations starting May 1st (around 6.7 million). They actually continued to rise slightly through August...followed by a gradual net attrition throughout the year, ending with around 6.3 million still enrolled as of the end of December, for a monthly average of around 5.5 million people vs. the 8.0 million who had actually selected policies during open enrollment...a ratio of 68%.
In 2015, the massive technical improvements, shorter open enrollment period and the fact that over 6 million people were already enrolled in exchange policies and thus could easily be renewed (either actively or passively) meant that effectuated enrollment ramped up much more quickly. OE2 ended on 2/15 (plus a 1-week "overtime" period), hitting 10.2 million in March, rising slightly more in April and then gradually dropping off to around 8.8 million on 12/31/15. 2015 averaged roughly 9.4 million monthly enrollees vs. the 11.7 million who selected plans during open enrollment...a far better ratio of 80%.
In 2016, the start and end dates of the open enrollment period were moved back by 2 weeks each, but it was otherwise pretty close to 2015, and both the enrollment and monthly effectuation/attrition pattern followed pretty closely as well: Peaking at 10.8 million in March (although last year's CMS report claimed it was 11.1 million?), then a gradual monthly fade-out to 9.1 million. Monthly average: 10.0 million, or 79% of the OE3 selections, pretty much in line with 2015.
For 2017, of course, we only have 2 months of data so far...but it appears to be starting out slightly better than last year even though the total number of QHP selections was half a million lower. I may have to adjust this as further data/clarification comes in from CMS in the future, but my guess is that when all the March effectuation data is added in, it'll peak at roughly 10.9 million for March, then slide down throughout the year, ending at roughly 9.2 million in December. The monthly average will likely be something like 10.1 million people.
Of course, you can argue about how bad ending the year with 28% fewer people than officially signed up is anyway, but the point is that 2017's rates don't appear to be starting off any worse than the prior years, and may even be slightly better.
UPDATE: Well I'll be damned. PolitiFact decided to follow up themselves on this, including contacting CMS directly for clarification, and guess what?
In 2017, the Centers for Medicare and Medicaid Services looked at who made payments through the end of February. That is a full month shorter than the year before and out of step with the March 1 start date for many policies. (Some news reports said the figure was as of March 15, but the Centers for Medicare and Medicaid Service looked at payments made only through the end of February.) We asked why the federal agency changed its reporting timeline and did not get an answer.
In other words, my suspicions were accurate...as is my graph above: That 10.3 million figure refers to how many were effectuated as of February, not March.
Advertisement
