

Where Things Stand: The Graph & State By State
Tue, 01/10/2017 - 3:42pm
OK, with this morning's CMS/ASPE "mid-season report" being released, I figured this would be a good time to take a look at where things stand on both a state-by-state and national level. All of the state enrollment numbers should be accurate with the possible exception of California; there's a potential discrepancy of around 93,000 enrollees which I'm still trying to clarify. The tables/graph below all assume that those disputed 93K are supposed to be included.
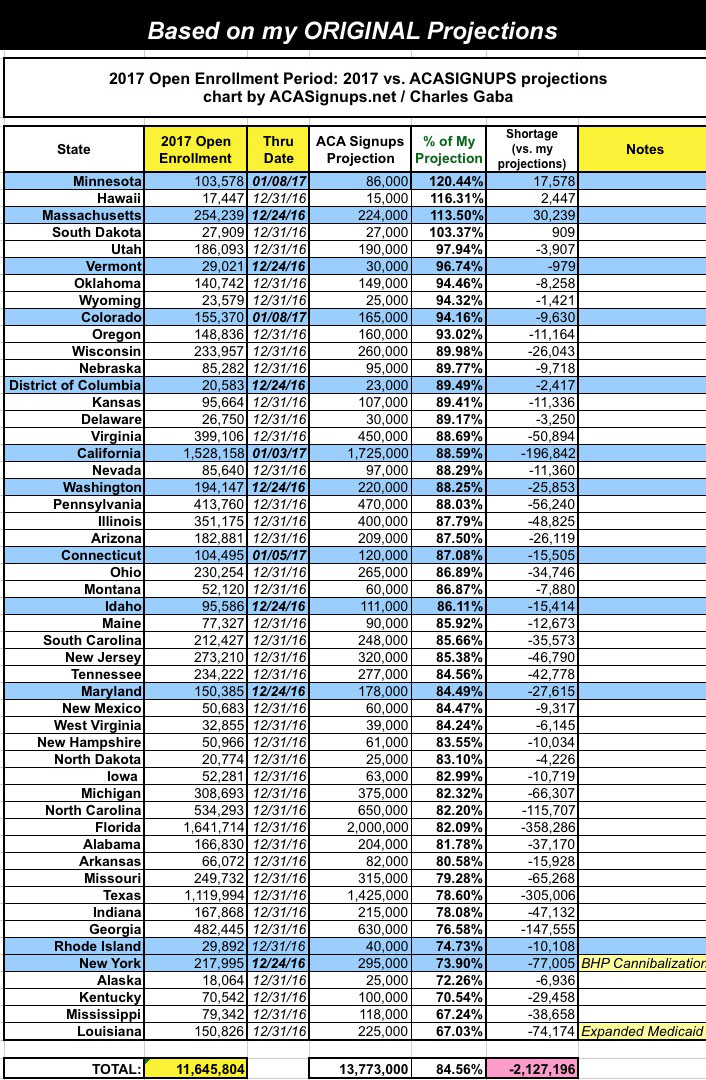
Here's my original projections for each state, sorted in order based on what percent of my personal target each state has reached. As you can see, Minnesota, Hawaii, Massachusetts and South Dakota have already broken 100%, with Utah, Vermont, Oklahoma, Wyoming, Colorado, Oregon and (possibly) California all over the 90% mark. Any state over 90% at this point should hit my targets by the end of January.
The problem is that there's another 28 states which are below the 87% threshold, including some big ones like Texas and Florida. Every state should be at roughly 89% by now in order to hit my national target of 13.8 million enrollees. There would have to be around 2.1 million additional new enrollee signups during January to pull this off; I just don't see that as being very likely at this point unless there's a massive "Holy Crap, Donald Trump is really President!" panic over the final 11 days.
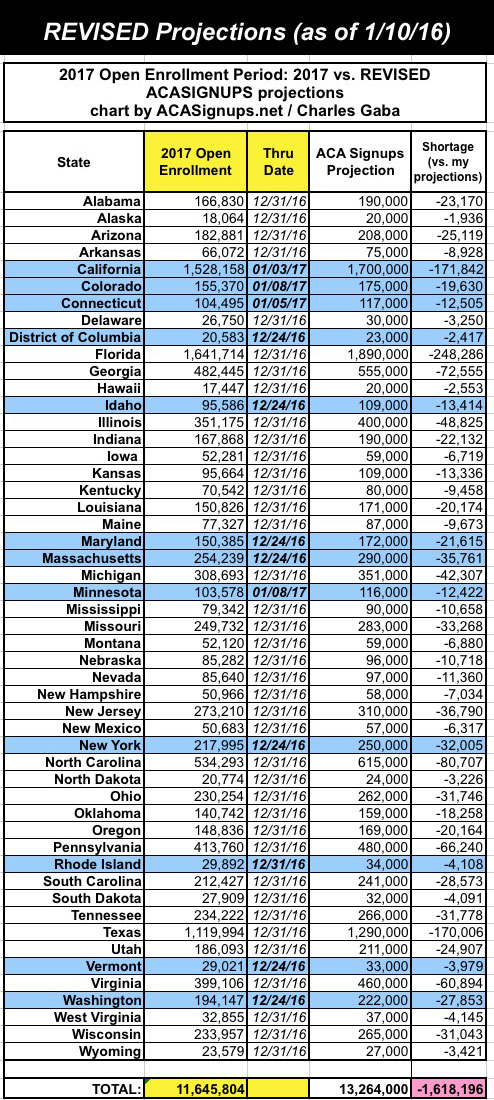
Therefore, last week I officially lowered my national projection down from 13.8 million to 13.3 million. I actually increased my targets for about a dozen states, but had to lower them significantly for about 30 others. On the state level, here's my revised targets (I'm not bothering with the percentages because they're all within the same 86-90% range):
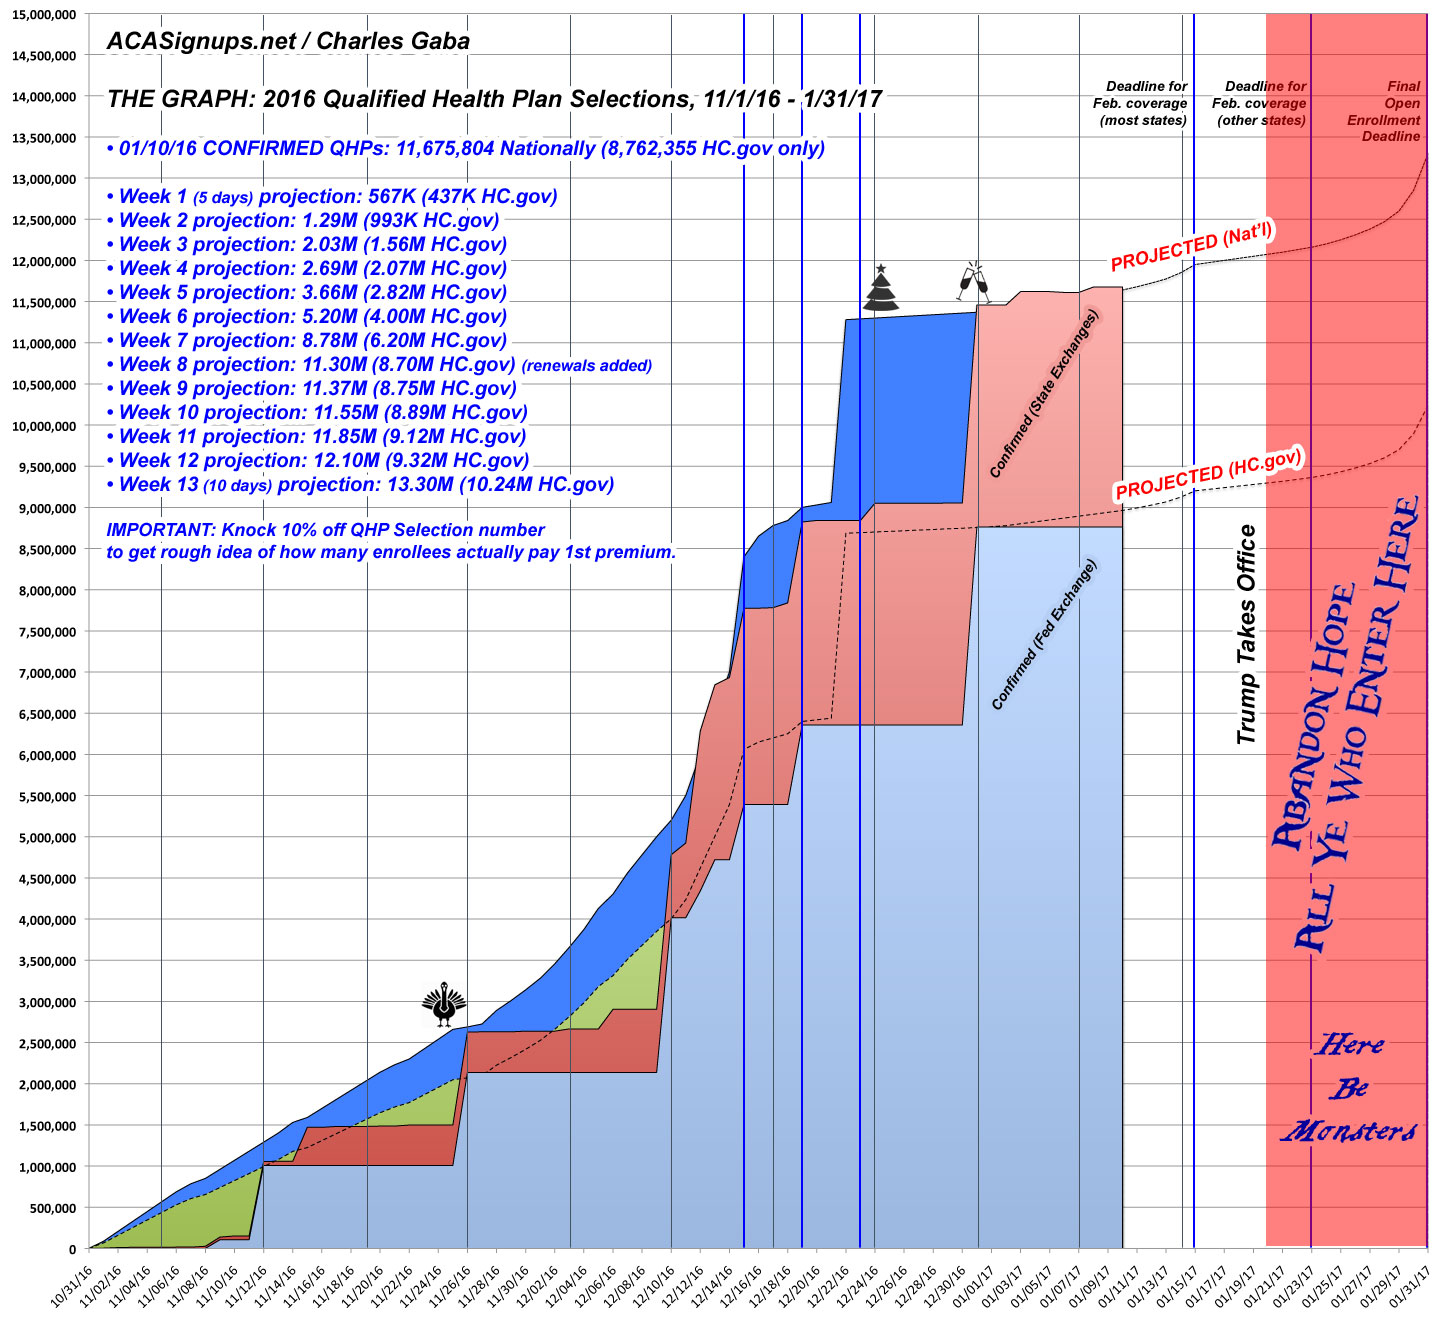
Meanwhile, assuming those 93K enrollees in California are valid, here's what The Graph looks like as of today: 11.68 million QHP selections confirmed with 21 days left to go.
Advertisement
