

Will the Young Invincibles save the day risk pool-wise?
Fri, 01/08/2016 - 9:34am
I wrote about this last night as part of a larger piece, but the "Young Invincible Risk Pool" issue from yesterday's official Open Enrollment Report seems to be generating a lot of hand-wringing, so I decided to write something specifically about it.
One of the biggest concerns people have about the ACA exchanges is whether or not there are enough so-called "Young Invincibles" (ie, young adults aged 18-34 years old) in the market to help balance out the risk pool. The assumption is that "YI's" are considerably healthier than older folks, and therefore should help reduce the overall cost of medical services over the coming year. From an insurance carrier POV, it's a lot more profitable to have 10,000 healthy customers than 1,000 cancer or diabetes-ridden customers. In the past, of course, this meant that carriers would cherry-pick their enrollees; if they suspected you'd be a high risk customer, they'd simply tell you to go pound sand.
Thanks to the ACA, however, carriers can no longer do that. You can't be denied coverage based on pre-existing conditions, and in fact they can't even ask about your medical history/condition at all. They can ask how old you are, however, so that's one of the biggest remaining factors in trying to estimate how costly the risk pool is going to be. It's no guarantee, of course; there are 25 year-old cancer patients and 60 year olds who can kick your ass, and my guess is that college kids are a lot more prone to injuries such as car crashes, sports injuries, kayaking/parasailing/etc. accidents and the like. Still, overall the "Younger = Less Expensive" theory is likely quite true.
This is why yesterday's ASPE report, while chock full of handy data, also caused some concern among healthcare wonks because of this:
Approximately 35 percent of the individuals who selected, or were automatically reenrolled in, a 2016 Marketplace plan are younger than 35 (3.9 million out of 11.3 million).
Approximately 26 percent of the individuals who selected, or were automatically reenrolled in, a 2016 Marketplace plan are ages 18 to 34 (3.0 million out of 11.3 million).
The problem is that 26% is actually lower than last year's 28% in the 18-34 year bracket. The hope was that the percentage of "YIs" would increase going forward, to help keep premiums from increasing too dramatically.
HOWEVER, there's an important caveat to keep in mind: Young people tend to procrastinate. For the first two years of Open Enrollment, the proportion of younger enrollees increased substantially towards the end of the enrollment period.
For 2014, the final ASPE report included this graph, demonstrating this trend:
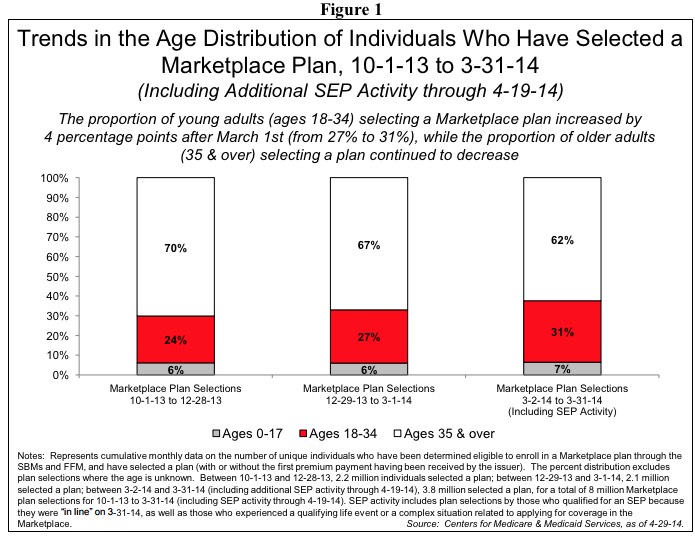
The red sections show how the "YIs" nudged up from 24% of enrollees during the first 3 months, to 27% of the enrollees during the next 2 months, to 31% of the final batch of enrollees (1 month, plus a 2-week "overtime" period). The resulting overall risk pool ended up being 28.0% for the first year.
Unfortunately, ASPE didn't include a similar graph for the 2015 Open Enrollment Period. In addition, the above graph for 2014, while useful, doesn't make it clear what the proportions of total enrollments are; at first glance it makes it look like each bar represents 2 months of enrollment (or, alternately, that each bar represents 1/3 of the total enrollment number). You have to read the caption underneath each bar carefully to realize that the bars represent 3 months, 2 months and 1.5 months respectively. On top of that, anyone who remembers the 2014 Open Enrollment Period knows that the enrollments were not distributed evenly throughout the 6.5 month period whatsoever; there was a huge surge in late December...but an even bigger surge at the end of March/early April, skewing the breakout.
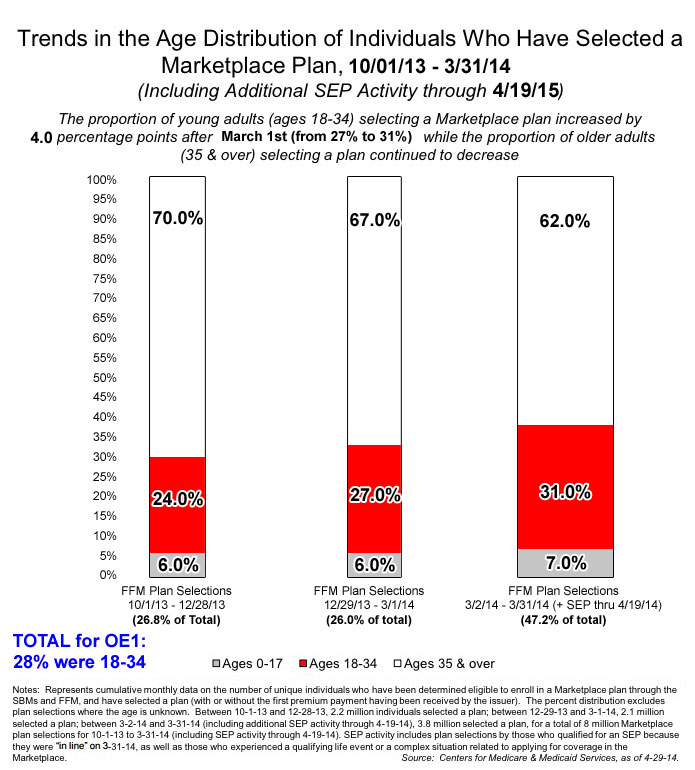
In response to this, not only have I created a more accurate (and more easily readable) version of the graph for 2014, I've also dug into the 2015 ASPE reports and created a similar graph for the second Open Enrollment Period. The only caveat for the 2015 version is that it includes HealthCare.Gov states only, not the State-Based Exchanges...except that the variances between the two appear to be pretty nominal, so it should still be pretty representative of the trend.
First, here's the modified 2014 graph. Again, I've enlarged the bars and percentages to make them more legible; more importantly, I've changed the width of the bars to show the percentage of total enrollments that each represents. As you can see, the nearly as many people enrolled in the final 6 weeks as the first 5 months combined. This resulted in that 31% "YI" figure bringing the overall average up a full 4 points from the first half of the period, for an overall average of 28% in the 18-34 bracket:
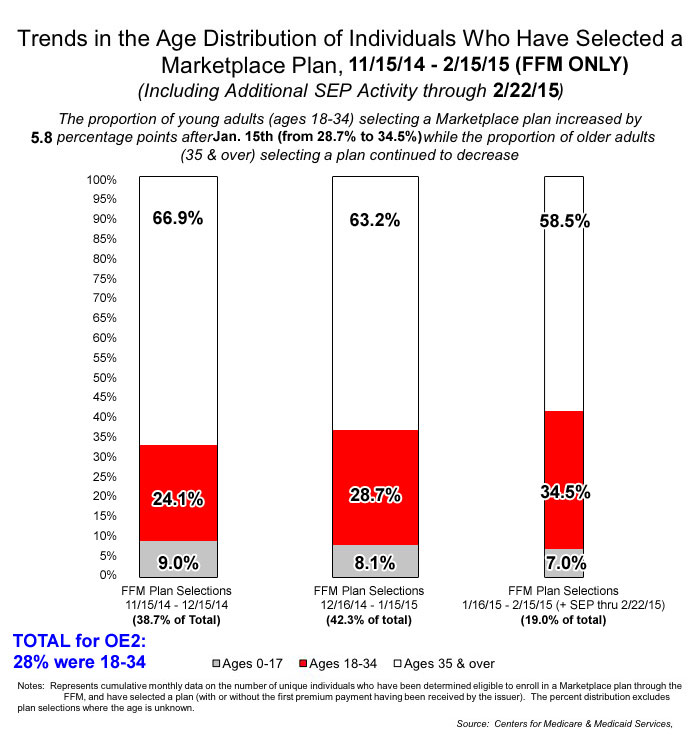
Next, we have the 2015 graph. Again, for this, I had to dig into the ASPE reports from December 2014, January 2015 and February 2015 to get the breakout by month.
This graph paints a very different picture, both in terms of the Young Invincible percentages but also the proportion of total enrollmetns. For one thing, unlike 2014, each bar really does represent roughly the same time period (one month, one month, one month + a one-week "overtime" period).
More importantly, however, this time over 80% of the total enrollments occurred in the first 2/3 of the enrollment period. This is mainly because of the huge number of renewals (whether active or automatic) from 2014, which obviously wasn't a factor the previous year. The other major reason for this "front-loading" is that unlike the October 2013, when there were horrific technical problems at most of the exchanges, by November 2014 these had been mostly smoothed out.
In any event, the same trend was still present: 24.1% Young Invincibles in the first third, 28.7% in the second third, leading up to a very impressive 34.5% in the final 5 weeks. In other words, those scrambling to sign up at the deadline last year trended very young. The only downside to this is that while YIs made up over 1/3 of the final batch of enrollees...there just weren't that many of them relative to the rest of the year, so their numbers were only enough to pull the overall average up to...the same 28% as 2014.
So, what about this year?
Well, we're only 2/3 of the way through the open enrollment period, but it's safe to say that somewhere around 80% of total enrollments are already baked into yesterday's ASPE report (11.3 million would be 80% of 14.1 million). I can't whip up a graph like those above for this year, partly because the enrollment period isn't over yet, partly because the report includes both November and December, making it impossible to break out into 3 columns anyway. However, that's not necessary; we can use the number given to see where we're at (again, this is for HC.gov enrollees only; it doesn't include the state-based exchanges):
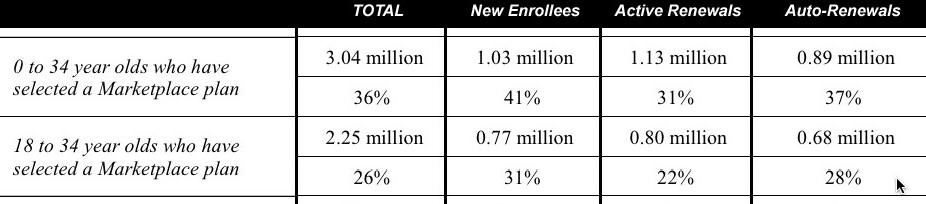
2.25 million, or 26.4% of the 8.52 million via HC.gov so far are 18-34. However, note the difference between renewals (24.5%) versus new enrollees (31%). As Larry Levitt noted yesterday, "New ACA enrollees are disproportionately younger. Renewing enrollees are disproportionately older. Net effect is a similar risk pool."
So, assuming the state-based ratios are similar, what would it take to raise the percent of YIs to, say, 29% overall?
Well, assuming only 20% of the total is left to go, it would have to be:
- 80% x 26.4% = 0.2112
- 20% x 39.4% = 0.0788
- 0.2112 + 0.0788 = 0.29 = 29.0%
Yeeks. Over 39% of the remaining batch would have to be 18-34 to raise it that much.
However, to hit the same 28% as the last two years, you'd only need:
- 80% x 26.4% = 0.2112
- 20% x 34.4% = 0.0688
- 0.2112 + 0.0688 = 0.28 = 28.0%
...34.4%, which is actually slightly lower than the "final push" last year.
Of course, if the grand total comes in higher than 14.1 million (let's say, my personal projection of 14.7 million, or 23% left to go), the numbers would change:
- 77% x 26.4% = 0.20328
- 23% x 33.3% = 0.07659
...just 33.3% of the remainder would have to be 18-34 to equal last year, which shouldn't be a problem.
On the other hand, if total enrollments end up lower than 14.1 million (say, just 13.5 million, of which 11.3 million = 83%), it'd be a tougher grind:
- 84% x 26.4% = 0.22176
- 16% x 36.4% = 0.05824
You can play around with these numbers all day; the point is that until the dust settles at the end of January, there's no reason to panic over the "Young Invincible" factor.
Advertisement
