

ASPE Enrollment Report: Digging into the Weeds, Part 1
Thu, 01/07/2016 - 8:49pm
Now that I've managed to catch up with the "big picture" data dump from today's APSE Enrollment Report at both the national and state levels, it's time to dig into the meat of the report: Demographic Breakdown!
I'm not going to get into everything here, of course; a lot of this stuff is beyond my pay grade (which is to say, zilch, as I'm not paid to operate this site), while other stats just aren't of any particular interest to me, though obviously they may be useful to others. I'm mostly just running through all 81 pages (27 in the main report, 54 in the state-level supplemental) to see what catches my eye.
This entry will focus purely on the main report; I'll look at the supplemental report (which goes into state-level data) tomorrow.
Within the Marketplaces as a whole (all 50 states +DC):
- Nearly 11.3 million individuals selected, or were automatically reenrolled, in a 2016 Marketplace plan (including 3.0 million new consumers and 8.2 million reenrollees) as of December 26, 2015.
Note: The grand total was actually up to 11.38 million as of a week later (122,000 higher than this report shows). Virtually all of the additional 122K are newly enrolled, so it's more like 8.2 million renewals to 3.1 million new enrollees. From now through 1/31, practically all additional enrollees should be new, with a small number of exceptions such as those who were cut off from their Co-Op plans when the carriers went belly up but who haven't found alternate coverage yet. These people actually have until March 1st to find a new policy due to the 60-day Special Enrollment Period exception for people who's coverage was lost when it wasn't their fault.
- Approximately 35 percent of the individuals who selected, or were automatically reenrolled in, a 2016 Marketplace plan are younger than 35 (3.9 million out of 11.3 million).
- Approximately 26 percent of the individuals who selected, or were automatically reenrolled in, a 2016 Marketplace plan are ages 18 to 34 (3.0 million out of 11.3 million).
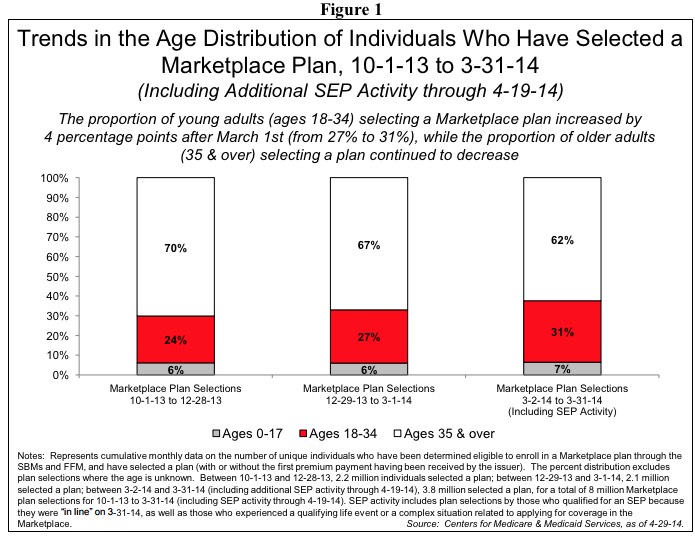
At first glance, this looks bad compared to last year’s open enrollment, when 36% were under 35 and 28% were 18-34.
However, both of these numbers should improve by the end of Open Enrollment, since younger folks tend to hold off until the last minute to sign up (not just the December deadline, mind you: The final deadline on 1/31). Consider 2014:
Let’s suppose that the total does manage to hit my 14.7M target by the end of open enrollment. Let’s further suppose that the same 31% of the additional 3.4 million are 18-34. 11.3 million = 77% of 14.7 million.
If so, that would bring the total up to:
- 26% x 77% = 0.2002
- 31% x 23% = 0.0713
= 0.2715 = 27.2% in the 18-34 bracket, or 1.2 points higher than last year.
Of course, if the final total ends up lower (say, 14.0 million, which is probably more likely at this point), the percent of Young Invincibles in the final month would have to be higher still; let's say 33%. 11.3 million = 81% of 14.0 million.
- 26% x 81% = 0.2106
- 33% x 19% = 0.0627
= 0.2733 = 27.3% in the 18-34 bracket, or 1.3 points higher.
It's really just a question of whether that "Final Deadline Surge" is a) large enough and b) includes a higher enough percentage of "Young Invincibles" to bump the average up a couple of points.
- More than half of the 8.2 million consumers who reenrolled in Marketplace coverage were active reenrollees (4.2 million, or 51 percent).
The discrepancy between the HC.gov and SBM states here is kind of interesting. Over 60% of HC.gov renewals were active, versus only 27% of SBM renewals. I'm guessing the main reason is because 3 of the 11 Co-Ops which failed (thus forcing their enrollees to shop around) were located in SBM states (Colorado, Kentucky and New York), and those three happened to have substantial enrollment numbers. There could be other reasons as well, however.
Within the HealthCare.gov states:
- HealthCare.gov users are actively shopping and saving money. Within the 38 HealthCare.gov states, 3.6 million reenrollees actively selected a plan. Of those active reenrollees, 60 percent switched to a different plan than they had in 2015.
That's pretty impressive: 60% of 60%, which means that 36% of all active HC.gov enrollees switched plans. Unfortunately they don't include similar data for the state-based exchanges.
- (Healthcare.Gov Only): More than 8 in 10 individuals (nearly 7.1 million, or 83 percent) who selected or were automatically enrolled in a 2016 plan through the Marketplaces in the HealthCare.gov states qualify for an advance premium tax credit with an average value of $294 per person per month.
- More than 8.5 million people selected or were automatically reenrolled in 2016 plans through the Marketplaces in the 38 states that are using the HealthCare.gov eligibility and enrollment platform (see Table 1).
- During the 2016 OEP, the number of Marketplace plan selections in the HealthCare.gov states has been higher when compared to the 2015 OEP (see Figure 1).
- More than 2.7 million people have selected or been automatically reenrolled into 2016 plans through the Marketplaces in the 13 states (including DC) that are using their own Marketplace platforms in 2016
The next table goes back into the age brackets again (remember that this is only for the HC.gov states; the SBMs could have some variances:
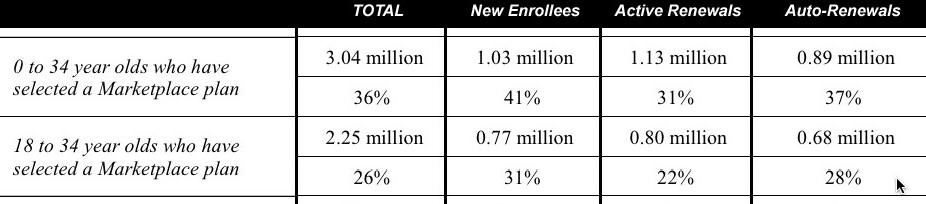
Here you can see that when you combine active and auto-renewals, only 24.5% of all HC.gov renewals were in the 18-34 bracket...while fully 31% of new enrollees to date have been 18-34. As noted above, as long as the January enrollees continue to hit 31% Young Invincibles (and the total number is large enough), the total percentage should nudge about a point or so above last year.
The same table goes into all sorts of other demographics (ethnicity, gender, etc, which isn't really of concern to me here).
Lessee, what else...nationally...
- Metal Level: 68% have signed up for a Silver plan, 22% Bronze, 7% Gold, 2% Platinum and 1% Catastrophic.
- Standalone Dental Plans: 1.4 million people signed up for one of these.
- APTC: When you include the state-based exchanges, the percent drops a smidge to 82%.
- Income Level: (this is for HC.gov states only):
- 3% are below 100% FPL (eh???)
- 37% are at 100-150%
- 24% are at 150-200%
- 15% are at 200-250%
- 9% are at 250-300%
- 9% are at 300-400%
- 3% are over 400% FPL
This is kind of interesting, as it's a reminder that being under 400% FPL does not guarantee that you'll receive tax credits (remember, 18% aren't receiving financial assistance, but only 3% are over 400% FPL, so there's an additional 15% who are under 400% but don't qualify for credits for whatever reason).
UPDATE: thanks to Andrew Sprung for noting that fully 8% of the HC.gov enrollees don't have any known income level listed, so the numbers are a bit different. More from him on this subject here.
Advertisement
