

STATE BY STATE: 31 states running ahead of projections, 15 running behind (but look out ahead)
Thu, 01/14/2016 - 10:19am
I launched the "State by State" chart feature towards the end of the 2015 Open Enrollment period last time around, and it proved to be pretty popular, so I've brought it back this year.
Note that whle the enrollment numbers for most states below are current through January 9nd, most of the state-based exchanges are either slightly more current or up to two weeks behind.
With that caveat out of the way:
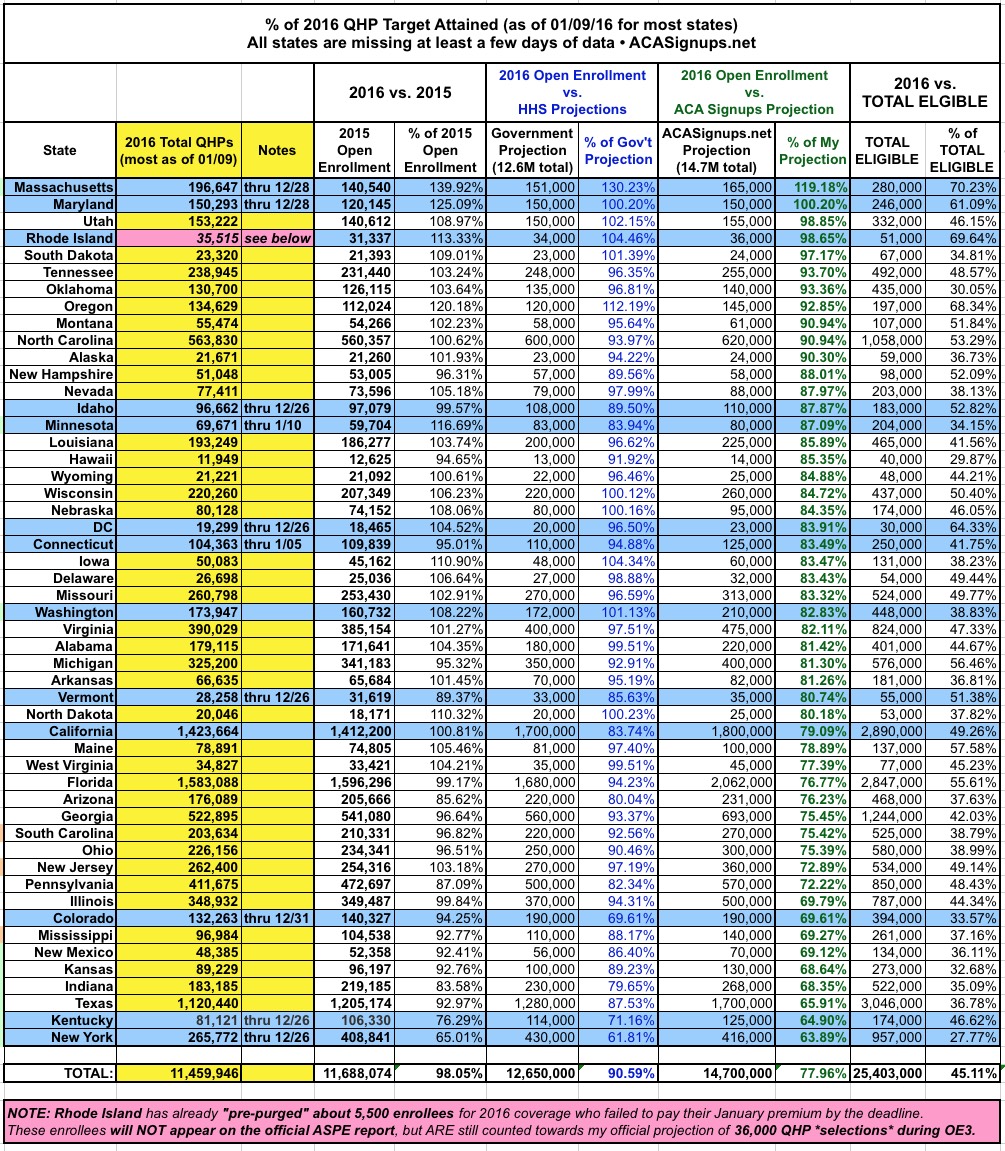
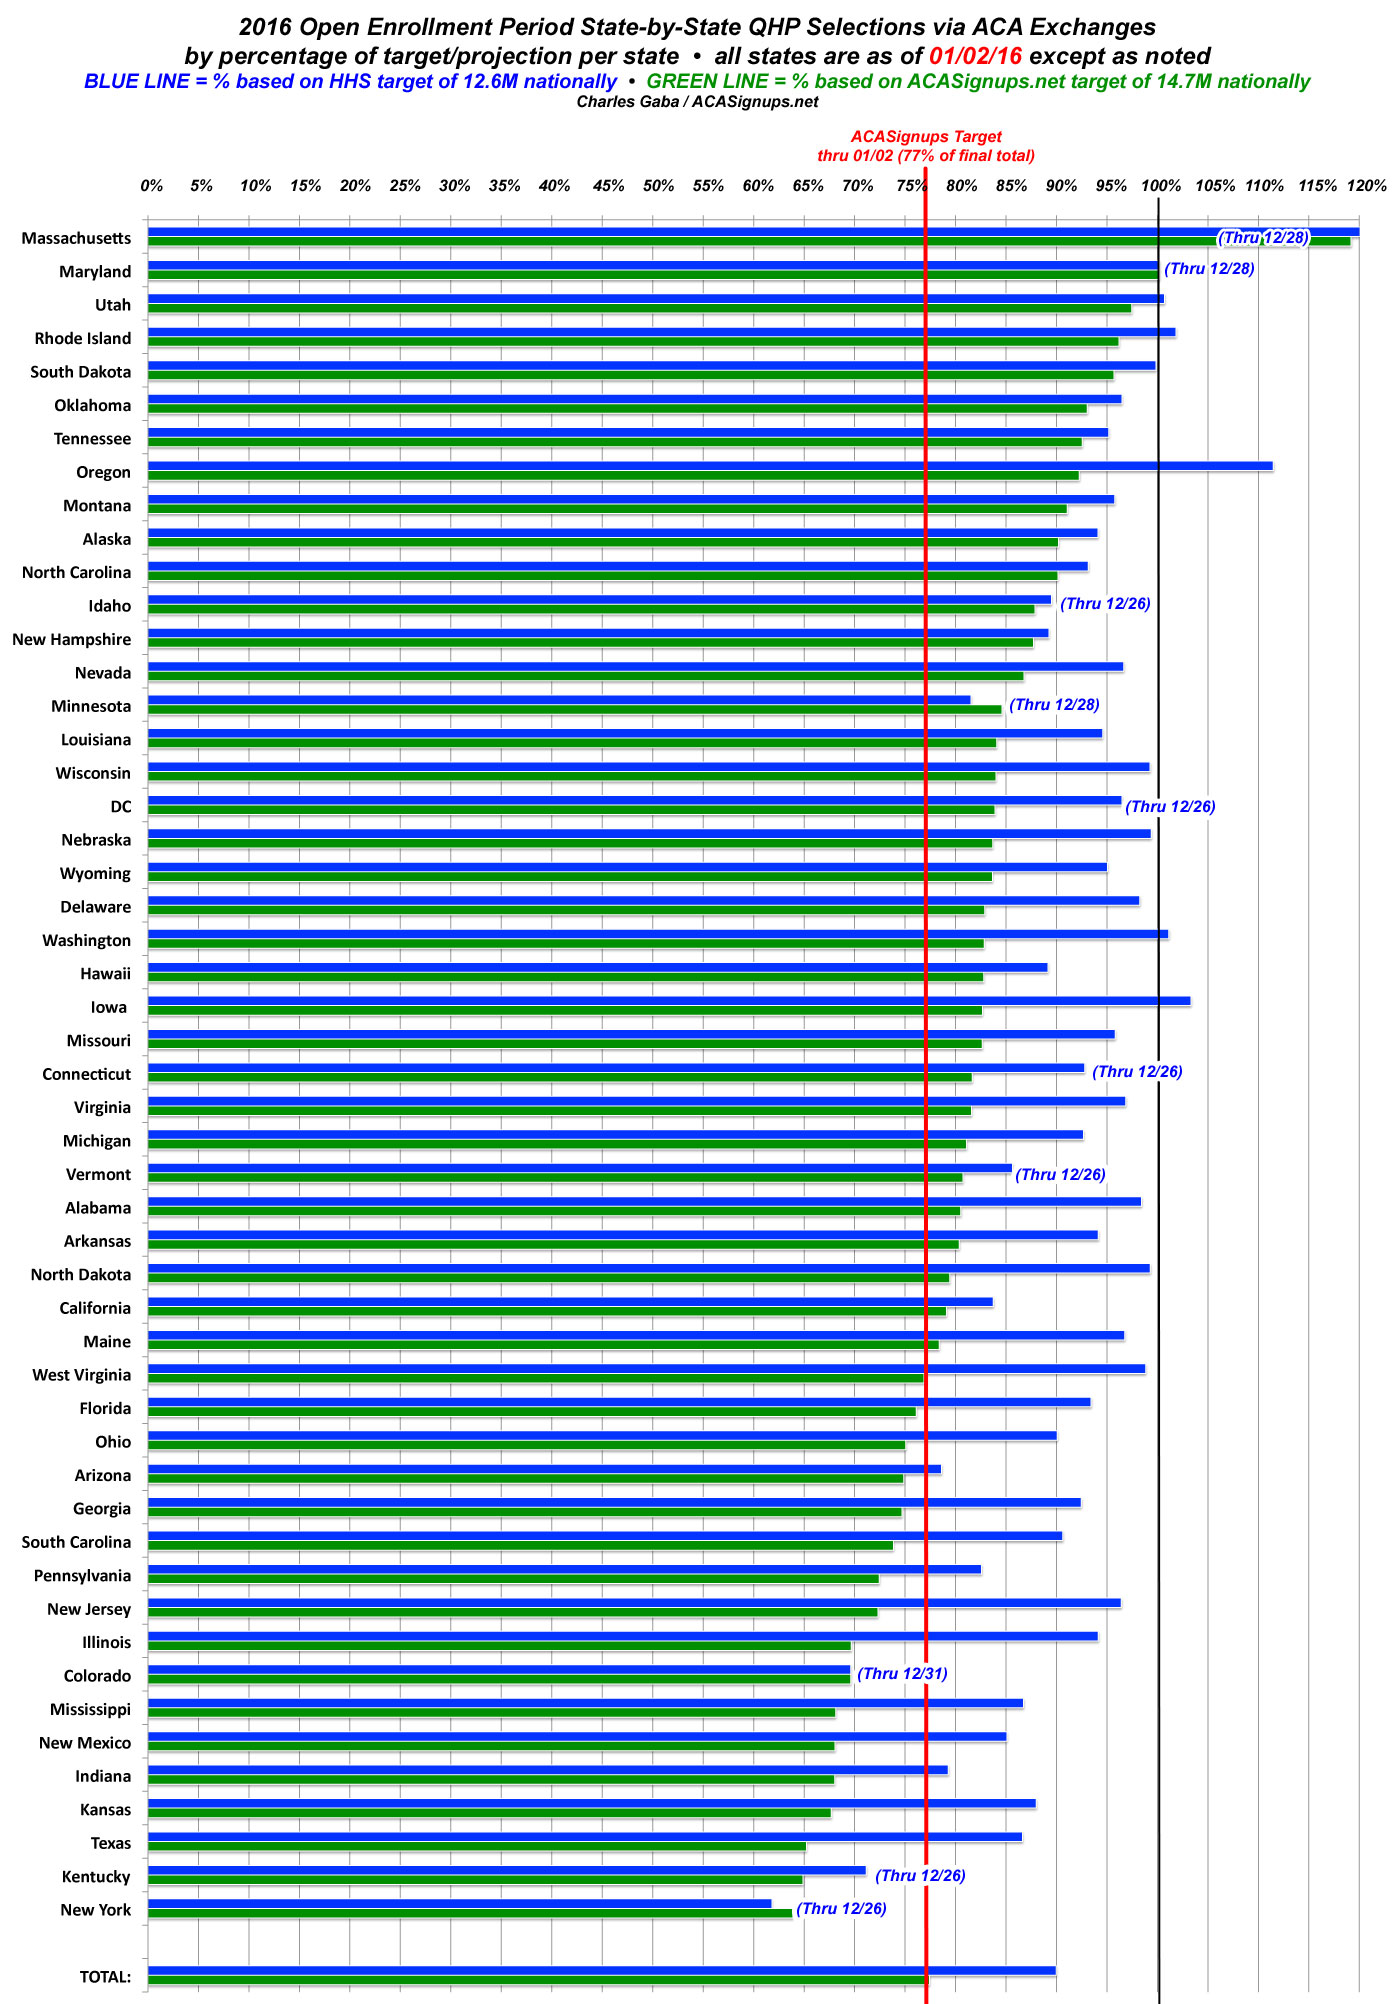
- The BLUE LINES represent the percentage of QHP selections each state had achieved as of January 9th for most states compared to my best guess at their reasonable proportion of the 12.6 million people the HHS Dept. expects to select plans nationally. In some cases (California, Colorado, Connecticut, Idaho, Maryland, Minnesota and Vermont), I've used the official target number for that state, according to the exchange itself. For other states, I took a proportionate number based on the HHS Dept's 12.6 million total.
- The GREEN LINES, meanwhile, represent MY personal projection of how many people I expect to select QHPs during open enrollment this year. Again, with the exception of CA, CO, CT, ID, MD, MN & VT, none of these targets are official.
- Finally, I've included a vertical RED LINE. This represents the point I think each state should have been as of January 9th (around 11.50 million total, or 78% of the 14.7 million total I was originally projecting nationally by January 31st).
The Good News: There are 31 states running at least 2 points ahead of where I expected them to be as of January 9th (ie, 80% of my projection or more).
The states which continue to overperform the most are Massachusetts (65K ahead); Maryland (35K ahead); Utah (30K ahead); Tennessee (40K ahead; Oklahoma & Oregon (20K ahead each); and North Carolina (80K ahead).
The Bad News: There are 15 states running at least 2 points behind where I expected them to be at this point (ie, 76% or lower).
While there are more than twice as many states running ahead as behind at the moment, it's important to note that the "behind" column includes major states like Georgia & New Jersey (20K behind each); Indiana (25K behind); Florida (30K behind); Pennsylvania (35K behind); Illinois (40K behind); and especially Texas, which is a whopping 210K behind where I would've expected it to be by now.
New York is also running about 60K behind, but for a very specific reason: Their brand-new Basic Health Plan is "cannibalizing" more of the QHP enrollees than I had expected (which I should have).
While things still look good as of today, I see the percentages dropping off starting next week. I've officially dropped my overall OE3 projection from 14.7 million down to around 14.0 million, and this will likely start being reflected with the Week 11 Snapshot Report. Since I'll still be dividing the number for each state into my original target, I expect to start seeing the "Ahead of Projections" list drop while the "Behind Projections" list starts to grow...but we'll just have to see...
One other important thing to note which relates directly to the above: Look what's happening in Rhode Island. I'll be writing a whole separate piece about this, but as you can see, RI's number is noticably skewed because they've actively purged around 5,500 people who failed to pay their January premium by the deadline from their officially-reported total. Since my official targets have always been based on the number of QHPs selected (whether the enrollee ends up following up with their first payment or not), this is obviously an important distinction: Rhode Island's official number (30,015) is over 15% lower than the actual number who've selected policies.
(click the chart to load a full-sized version in a new browser window)
Advertisement
