

UPDATED: Avik Roy's latest is kind of embarrassing.
Mon, 12/07/2015 - 2:27pm
Out of all of the 2,500+ blog entries I've posted over the past 2+ years here, the one I'm most proud of was "A Response to Avik Roy", from March 25, 2014 (written right in the thick of the crazy, frenzied final week countdown of the first ACA Open Enrollment Period). This was when the site was at its highest traffic level and I was at my highest point of media attention. I was doing nothing but updating the site for about 16 hours per day, interrupted only by eating, sleeping and being interviewed by every outlet under the sun. Needless to say, I was frazzled, exhausted and short-tempered, and in fact I ended up falling victim to a nasty case of shingles as a result immediately after the close of the April 15th "Overtime Period" a couple of weeks later.
The gist of the spat with Roy was this: He kept insisting that only 27% of those who had enrolled in private ACA exchange policies were newly insured. He based this claim on a study by the McKinsey Center for U.S. Health System Reform.
Now, it's true that the McKinsey study did claim that:
Previously uninsured respondents accounted for 27 percent of February respondents who reported having selected a new 2014 product (i.e., insured who switched and previously uninsured who enrolled), up from 11 percent in earlier surveys.
HOWEVER, as I explained in vivid detail, this in and of itself was nearly meaningless for four reasons:
- First: As the McKinsey study itself stated, emphatically, no fewer than SEVEN TIMES, the 27% included both on and off-exchange enrollees. Since off-exchange enrollees made up about half of the individual policy healthcare market in 2014, this is no small thing.
- Second: Anyone who's already enrolled in an off-exchange individual policy is, by definition, already insured, whereas the exchanges had just launched. Therefore, by definition, off-exchange enrollees were far less likely to be newly insured in the first place. The lower the percentage of off-exchange enrollees who are newly insured, the higher the percentage of on-exchange enrollees are.
- Third: Furthermore, the McKinsey study didn't specify whether the on/off ratios were proportional. That is, if 50% of the individual market was on-exchange and 50% off, that doesn't mean that McKinsey's pool was 50/50 as well. It could have been 60/40, or 20/80 for all I know.
- Fourth: Roy's piece was published in March, but the McKinsey survey was performed in February. Since only 3.8 million of the 8 million people who would go on to select private policies for the 2014 Open Enrollment Period had even done so as of mid-February, it was pretty stupid of Roy to make such a declarative statement. After all, McKinsey's report stated in the very same sentence that their 27% was up from 11% in their earlier survey; there was plenty of reason to expect the percentage to continue to increase.
At the time, I stated that my own off-the-cuff guess was that it would turn out to be perhaps 50/50...that is, that around half of the first-year ACA exchange enrollees would be newly-insured, the other half would be "switchers" such as my own family (we moved from an off-exchange BCBSMI policy to the closest on-exchange equivalent plan they offered). Roy actually had the chutzpah to accuse me of "cherry picking" when he was the one doing so.
As it turned out, in the end, not only was I correct, it was even higher than I had thought: A Kaiser Family Foundation survey found that 57% of ACA exchange-specific QHP enrollees were newly insured. A similar survey earlier this year by the Commonwealth Fund pegged it at 53% (lower percentage, but out of a higher raw number).
So, yay me, right? Roy never apologized or admitted that he had been wrong, of course, but whatever.
OK, so why am I dredging all of this up again today?
Obamacare has reduced the uninsured rate by only 2%
In 2010, when Obamacare was passed, the Congressional Budget Office projected that the law would reduce the number of uninsured in 2014 by 19 million, relative to the number of people without health insurance in 2010. By 2016, CBO estimated that 30 million fewer people would be uninsured.
Last week, CMS came to a different conclusion. According to their estimates, the number of uninsured fell by 12.6 million from 2010 to 2014. And 2010’s uninsurance rate was artificially higher due to the Great Recession; if you use 2008 as the baseline, the number of uninsured fell by only 6.7 million.
In other words, all of the disruption, spending, taxation, and premium hikes in Obamacare has only reduced the percentage of U.S. residents without health insurance by about 2 percent: a remarkably small number, and far lower than what the law was supposed to achieve.
And because growth in enrollment in Obamacare’s exchanges has flatlined, while premiums continue to go up, there’s little reason to believe that the ultimate reduction in the uninsured will ever reach 30 million under the law.
The level of disingenuousness here is staggering.
- First: When the CBO ran their 2010 projection, they didn't know that 20-odd states would end up denying Medicaid expansion (which by itself locks out around 3.1 million people...and even then, several of the states which did expand Medicaid put heavy restrictions on it which has probably tamped enrollment down by another million or so, I'd imagine).
- Second: Roy claims that "last week" CMS estimated that "the number of uninsured fell by 12.6 million from 2010 to 2014". He fails to provide a link to the CMS report from which he got that 12.6 million figure. I don't recall seeing this number last week, do you? I'm not saying he's wrong; in fact, I suspect he's correct. The closest I have is this CBO estimate of 12 million fewer uninsured in 2014. The point here is that he didn't provide a link to his source for a very specific, key data point. Perhaps it was just an oversight.
- Third: Roy's section header states that the ACA has "reduced the uninsured rate by only 2%" which makes it sound as though that includes 2015, doesn't it? Nope! It turns out he cut it off with 2014. While it's true that we won't have all of the 2015 data in for another few months (some surveys use snapshot-in-time coverage while others use "full or partial year" coverage), the fact remains that a good 3.7 million more people were covered by exchange-based policies as of June 2015 than December 2014 (10 million vs. 6.3 million), while there were 2.7 million more people enrolled in Medicaid as of August 2015 vs. December 2014 (72.4 million in August vs. 69.7 million in December). That's 6.4 million more people covered by one or the other for 2015 vs. 2014. Now, there may have been some reductions in other types of coverage such as ESI, but there's ample evidence to suggest that this hasn't been the case at all. In fact, the National Health Interview Survey from the Centers for Disease Control states that the total number of uninsured folks has dropped by 7.5 million since 2014, or 16.3 million from 2013.
- OK, so Roy decided not to include 2015 at the tail end of his calculations because it inlcudes 5-6 million inconvenient additional people. But what about at the front end? Well, for that, he decided to tack on an extra 2 years. Using a start date of 2010 (the appropriate year to use since almost none of the ACA provisions had actually started to kick in yet, seeing how the law wasn't actually signed until March and ramped up in stages over the next few years) wasn't convenient for Mr. Roy, so instead, he decided to go back 2 years earlier, to 2008. He claims that the number of uninsured fell by "only 6.7 million" from 2008 to 2014. What's his source for the 2008 figure? Again, he doesn't say. Perhaps it's in one of the other links in his story, but if so, I couldn't find it. However, I'm willing to accept his 2008 number based on Gallup's quarterly surveys.
- Anyway, let's assume that he's correct that from 2008 through 2014 (again, not including 2015), the net reduction in the uninsured was only 6.7 million. Roy's excuse for tacking on an extra 2 years is that 2010's rate was "artificially higher due to the Great Recession".
This last point is the one which really made my jaw drop.
First of all, as noted above, the actual number is more like 14 million from 2010 (when the law was signed) through June 2015 (the most recent point that we have solid numbers for). Out of 320 million people, that's over 4.3%, not 2%.
Furthermore, Roy is being too cute by half here by dividing the reduction in the uninsured by the total population instead of by the number of people who were uninsured to begin with. If you divide 14 million by 42 million uninsured, that's a 33% reduction. Roy didn't like that, so he used the full 320 million U.S. population...even though over 40% of them are also enrolled in socialized healthcare programs (about 50 million in Medicare, 72 million in Medicaid, over 9 million in the VA and so on).
Using the full 320 million figure is stupid for other reasons as well. For one thing, there are about 4.8 million uninsured undocumented immigrants who aren't legally allowed to be covered by any ACA provisions. Add these to the 3.1 million caught in the Medicaid gap and that's nearly 8 million people who can't get covered by the ACA no matter what (about 2.5% of the total population). The same holds true, for the most part, for U.S. territories such as Puerto Rico, Guam, etc. Add these up and that's another 4 million people who can't be considered in such a calculation.
In many ways, dividing into the full 320 million figure is as laughable as FOX News trying to claim that "94 million people aren't participating in the work force"...when well over half of those are either retirees or students.
However, even accepting the 2% figure, trying to use the recession as an excuse to push back a couple extra years is astonishingly obtuse.
Yes, the Great Recession, which officially started in December 2007 and ran through June 2009. As you may recall, President Obama didn't take office until January 2009 and his stimulus bill to clean up President Bush's mess didn't start taking effect until several months later...by an amazing coincidence, right around the point that the recession officially ended and the recovery began.
Seeing how healthcare spending makes up over 16% of the U.S. economy, I don't suppose it's dawned on Mr. Roy that the ACA itself might very well be a large part of the REASON for the economic recovery since 2008??
Here's the best metaphor I can think of: Let's suppose you were a long-distance runner until 2007. In 2008 you were in an industrial accident in which your leg had to be amputated. Then, in 2010, you were fitted with a new type of prosthetic leg.
Let's suppose that after several years of physical therapy you were back to long-distance running, with your prosthetic leg...and after clocking yourself, discovered that you were "only" 2% faster with the artificial leg than you were before your accident.
Would you be upset about that? Somehow I don't think so.
Or perhaps you were a champion cherry-picker before losing your arm...
UPDATE: Just to clarify: Whenever I run an "uninsured rate drop" estimate, I sometimes use a March 2010 start date and sometimes an October 2013 start date. However, I do this because both starting dates are important for different reasons; the first is when the ACA was signed into law, the second is the point when the two provisions which make up, by far, virtually all of the net coverage gains were kicked off (ACA exchanges with APTC/CSR and Medicaid expansion in most states).
I also always make sure to clearly mark both dates in graphs detailing the change over time:
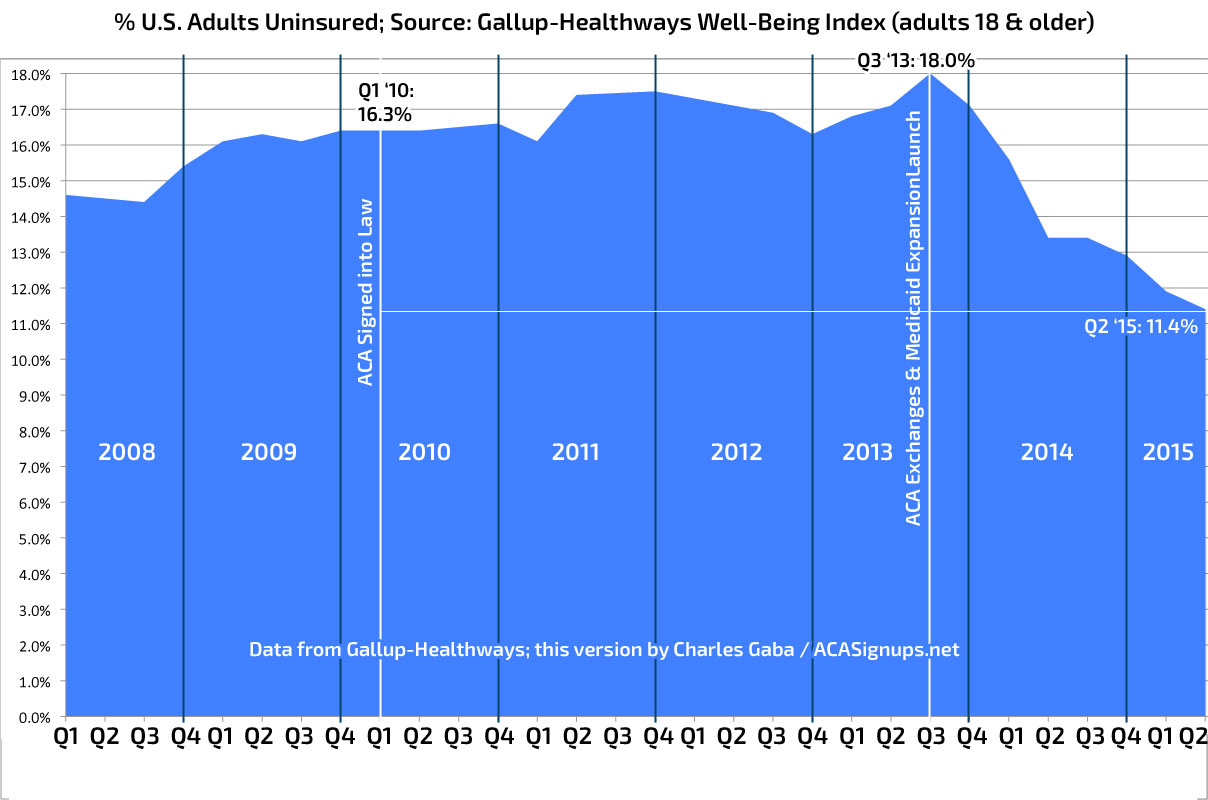
UPDATE x2: Thanks to Ken Kelly for pointing me towards the source of Roy's "6.7 million since 2008" claim (which, as I said, I wasn't disputing, I was just surprised that Roy didn't bother linking to it himself seeing how it's the lynchpin for his entire argument, even if the argument is still flawed in a dozen other ways anyway):
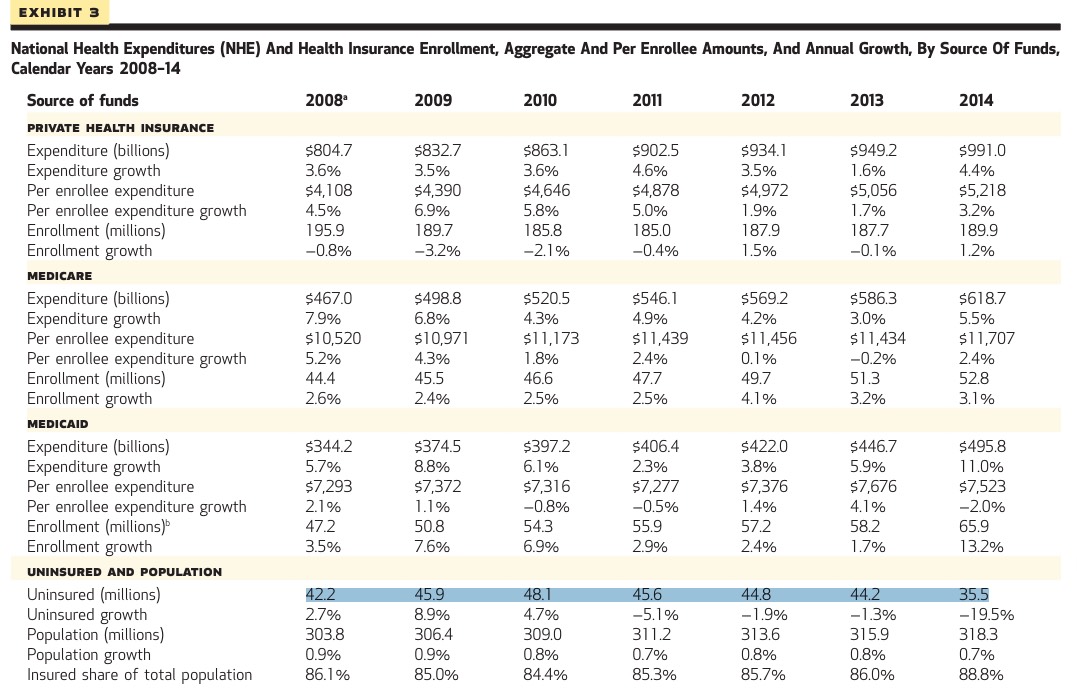
As you can see, even Roy's own source states quite clearly that the uninsured rate dropped by 5.1% in 2011, another 1.9% in 2012, another 1.3% in 2013 and a whopping 19.5% in 2014. The major ACA-related change in 2011 was the "sub26er" provision (allowing 19-26 year olds to say on their parent's plans). There weren't any significant provisions (at least ones which were connected directly to number of people covered) which kicked in during 2012 or 2013, however. Then came 2014, when both the exchanges (with tax credits and cost sharing reduction assistance) and Medicaid expansion kicked into gear...and whaddya know?
Kelly also points out another factor I hadn't even thought to mention: Population growth. Estimates vary by source, of course, but Roy's own source gives it as 303.8 million in 2008, 309.0 million in 2010 and 318.3 million in 2014. That means that even using 2008 as a baseline, as Roy insists upon doing, there were an extra 14.5 million people (or 4.8% more people, depending on how you look at it) in the country who had to be accounted for, which of course he doesn't do.
One other thing: The second half is all about the rate of healthcare spending growth. You'll notice that I'm not even bothering to go into this part of his article, and everything above is why. The sad part about this is that there is a legitimate debate to be had about whether both the expense of the ACA as well as the disruption it's brought to the U.S. healthcare industry is worth all the fuss and bother in order to "only" cover an additional (14 - 17 million people, give or take), along with the other requirements of the law (no more denials for pre-existing conditions; minimum basic coverage; etc). If Roy had approached the first half of his article honestly ("Uninsured has dropped by 15 million or so...is it worth it?"), then I might be able to take the second half of it more seriously, but by exaggerating so blatantly about the coverage numbers and percentages, he lost any credibility he might otherwise have had for the rest of it.
Advertisement
