

Missouri: 2016 Avg. Rate Request: 13.9% likely, 15.4% maximum
Fri, 07/31/2015 - 12:58pm
When I was crunching the numbers to come up with my rough estimate of the weighted average rate increase requests for Florida yesterday, I had a revelation: While Healthcare.Gov's Rate Review database, frustratingly, only includes rate requests higher than 10% (thus ignoring dozens of requests of under 10%, or even rate reductions in some cases), it does still at least provide guidance as to what the maximum average could possibly be.
For instance, let's say that there's a state with 4 insurance carriers, each of which has exactly 10,000 enrollees. Two of them are asking for a 20% and 15% increase respectively. Since those are both above 10%, they'll both show up on the Rate Review site:
- Company A: 20% request x 25% market share (10,000) = 5.00% weighted
- Company B: 15% request x 25% market share (10,000) = 3.75% weighted
- Company C: (unknown) x 25% share (10,000) = ???
- Company D: (unknown) x 25% share (10,000) = ???
- TOTAL = ???
Since the other 2 companies are missing data, there's no way of knowing what the total weighted average market share is...it's 8.75%, plus whatever the other 2 missing numbers are. However, while we don't know the other 2 rate changes, we do know that they have to be under 10% or else they'd be posted on the rate review site, right?
In other words, as long as we know the market share/enrollment totals for all of the companies, we at least know what the maximum weighted average could be:
- Company A: 20% request x 25% market share = 5.00% weighted
- Company B: 15% request x 25% market share = 3.75% weighted
- Company C: (assume 9.9%) x 25% share = 2.475% weighted
- Company D: (assume 9.9%) x 25% share = 2.475% weighted
- TOTAL: 13.7%
The maximum requested weighted average increase for this state would be 13.7%. Of course, if those other 2 companies are requesting smaller increases, it would be lower than that, and if one or both request decreases, that would lower the overall average further.
So, this partly solves the first mystery: We have a "cap" on the missing rate increase requests.
That leaves the other side of the equation: What if we don't know the actual enrollment (market share) for the missing companies? In some cases I've been able to hunt that down, but in other cases it's a trade secret or otherwise difficult/impossible to track down.
That's where this Kaiser Family Foundation report comes into play. It gives very specific estimates of the total individual market (including both on and off-exchange policies) for every state...as of 2014.
The bad news is that a) it's a year out of date (the individual market has grown since last year) and b) these numbers include "grandfathered" and "transitional" policies, which aren't part of the rate pool/rate requests that we're talking about.
The good news is that, overall, I'm pretty sure that these two numbers cancel each other out (or close to it). That is, while the total individual market has likely grown by a good 20% year over year (from 15.6 million to around 19 million), a similar portion of that is likely made up of grandfathered/transitional enrollees (around 3 million or so nationally).
Assuming this is the case--and assuming that these proportions are roughly accurate on a per-state basis, that means that I should be able to calculate the total number of "missing" individual, ACA-compliant enrollees by subtracting the "over 10%" subtotal from the grand total.
In other words, let's say that I had no idea what market share Company C and D had, either individually or combined. According to the KFF report, let's say that the 2014 total individual market for this state was around 40,000 people. Based on that, I'd simply have to subtract the 20K I know of to get a rough estimate of the balance:
- Company A: 20% request x 25% market share = 5.00% weighted
- Company B: 15% request x 25% market share = 3.75% weighted
- Companies C&D: (assume 9.9%) x (assume 50% market share) = 4.95% weighted
- TOTAL: 13.7%
Again, there's a lot of assumptions here. Some states may have grown their individual market by more or less than 20%. Some may have a higher or lower percent of grandfathered/transitional enrollees (and some states don't have transitional policies this year anyway). Even so, this is the best I can do for the moment without spending countless hours/days digging through SERFF filings and clunky databases.
With all of that in mind, here's what I've come up with for...Missouri:
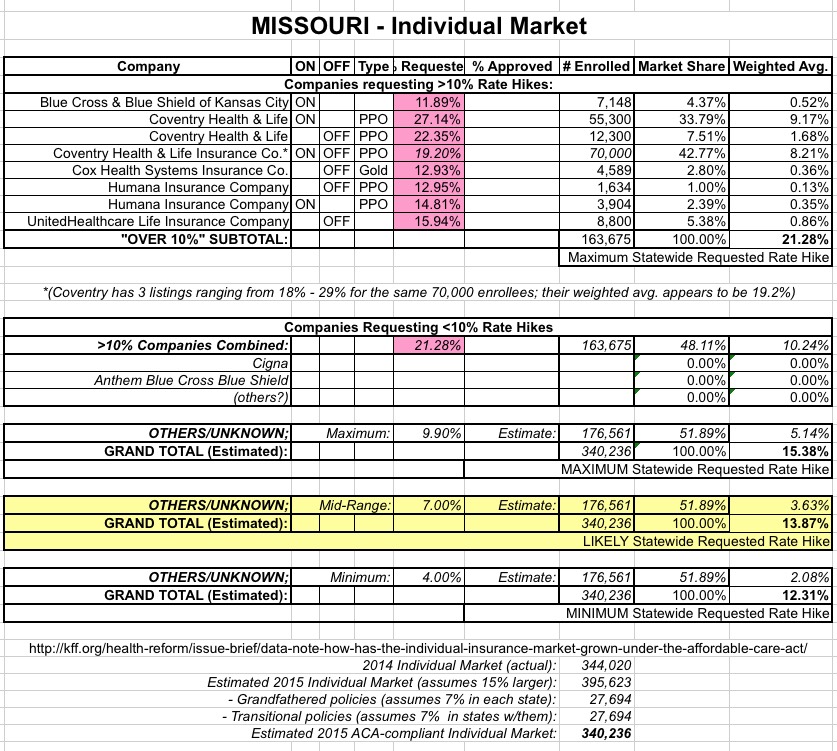
As you can see, if you only include the companies requesting >10% hikes, the weighted average appears to be about 21.3%...ouch!
However, these companies combined only make up 163,000 enrollees...when Missouri's total individual market last year was around 344,000. Assuming that growth and grandfathered/transitional plans cancelled each other out (again, that's a big assumption), there should be something like 176,000 Missourians enrolled in individual, ACA-comliant policies via companies which are requesting rate hikes lower than 10%. This includes Cigna, Anthem BCBS and possibly other companies operating off-exchange only.
If you assume that these other companies have around 176K of Missouri's total ACA-compliant individual market, and you assume that the weighted average for this subgroup is the maximum possible (9.9%), the overall weighted average drops down to 15.4%. That still stings, but it's a lot better than 21.3%.
UPDATE 8/4/15: I've also included two other scenarios: A "mid-range" and "minimum" estimate, based on the "unknown" carriers averaging 7.0% or 4.0% respectively. In cases like this, I'm using the "mid-range" as my best overall estimate.
Again, it could be even lower than that if the total ACA-compliant market is larger than 340K, or if the weighted average of the unknown carriers is less than 9.9%...but I find it very difficult to believe that it would be any higher.
Advertisement
