

New Table: Retention Overperformers/Underperformers
Tue, 06/02/2015 - 5:29pm
Today's massive data dump from CMS confirmed that my estimate a week or so ago of around 6.4 million people currently receiving federal tax subsidies in the 34 states at risk from an adverse King v. Burwell SCOTUS decision was dead-on target.
I've gone ahead and plugged the actual 3/31/15 effectuated enrollment numbers for each individual state into the spreadsheet so I can compare them against my own estimate for that state. Below is how it turned out. As you can see, overall I was pretty damned close: 10.08 million vs. 10.19 million, a difference of around 110,000 people, or just 1.05%. Better yet, I underestimated the effectuated enrollments by a smidge (much better than overestimating them).
However, there's an important caveat to keep in mind: The CMS numbers are as of March 31, while my own estimates are projections as of July 1st, the first day which the tax credits could potentially be removed.
Why is this important? Because while the normal off-season QHP additions are likely being cancelled out by other people dropping their policies, there's an additional 214,000 or so private enrollments which aren't included in CMS's 10.19 million total.
How do I know this? Because while around 48,000 people selected a plan via the Tax Filing Season Special Enrollment Period between 3/15 - 3/31 (36,000 on HC.gov, perhaps 12,000 more across the other 11 participating states), none of those policies became effectuated until May 1st. In addition, another 166,000 #ACATaxTime enrollments came in during April, which again, wouldn't be counted until May 1st and thus shouldn't be part of today's 10.19 million figure.
In other words, when you include the additional enrollments which came in between 3/15 - 4/30, the national total will likely be around 180,000 higher as of the end of the June...or roughly 10.38 million.
The good news is that this is about 300,000 people more than I've been estimating until now.
The bad news is that this also means roughly 105,000 more people who would lose their tax credits in the event of an adverse King v. Burwell ruling than I've been estimating:
- 147K of the #ACATaxTime enrollments were via HealthCare.Gov
- Assuming that about 3% of those were in Nevada/Oregon/New Mexico, that leaves around 143,000 in the other 34 states.
- Further assuming that about 87% of those are paid & effectuated by the end of June (10.2 / 11.7 = 87%), that leaves 124,000.
- Finally, assuming 85% of those are receiving tax credits by the end of the month, that's an extra 105,000.
And that, my friends, is why even though the table I've been using claimed around 6.4 million, the ballpark number I've been using since back in mid-April has actually been 6.5 million.
HOWEVER, that's a separate issue. For the moment, I can only compare against the official CMS number, so here goes:
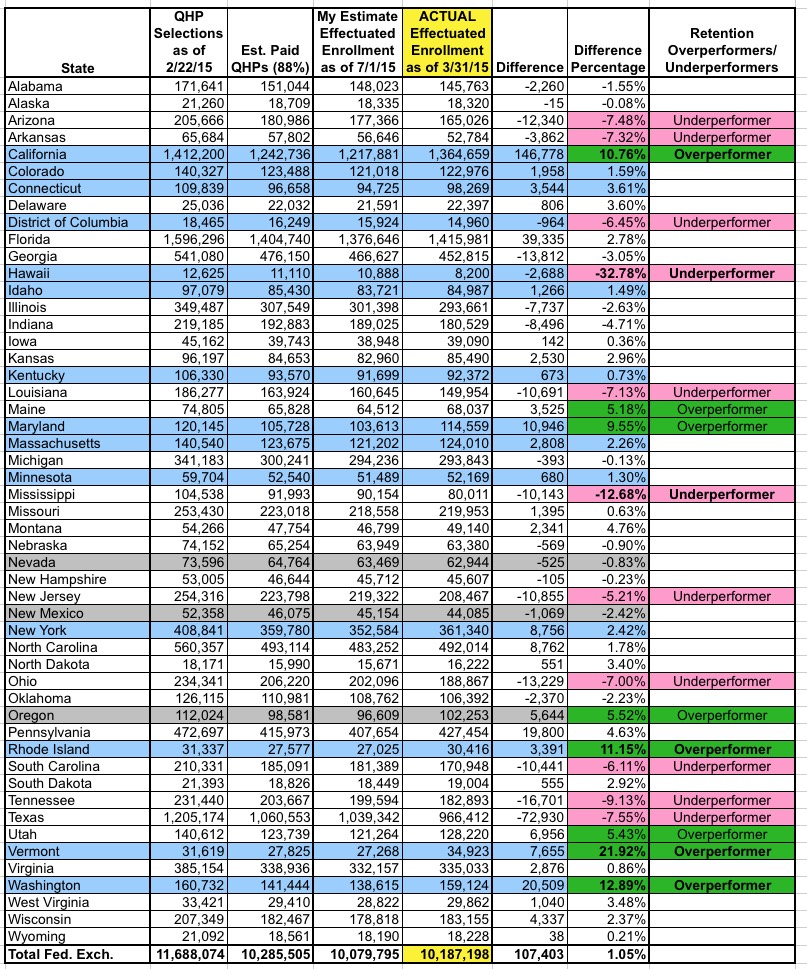
For the individual states, I fared less well. On the table I've highlighted any state where my estimate is more than 5% too high (underperformers) or 5% too low (overperformers).
I was within 5% in 32 states, which I think is pretty good. I was within 10% for another 13 states, which isn't great but seems reasonable given the data limitations I was working with at the time.
However, the other 6 states are pretty surprising: 2 states have seen shockingly high attrition rates (remember, this is as of March 31st, a mere 6 weeks after the end of Open Enrollment), while 4 others have extremely impressive retention rates...that is, they had far more people still enrolled as of the end of March than I would have expected. I'm gonna focus on these six states; some have obvious explanations, others are a mystery:
UNDERPERFORMERS:
- Mississippi: -12.68%. What can I say...it's Mississippi.
- Hawaii: -32.78%. Holy smokes, that's a disaster. Only 8,200 people still enrolled and paying across the entire state as of the end of March? Yikes.
OVERPERFORMERS:
- California: +10.76%. Yes, I know, California severely underperformed during the actual open enrollment period. However, that's not what we're talking about here; I'm looking at what percentage of those who did enroll actually paid up and are sticking around, and on that basis it's a pleasant surprise: Over 140,000 more people than I had estimated. Let me put it this way: If CA hadn't overperformed here, my national estimate would be coming in 30K over instead of 110K under the actual number.
- Rhode Island: +11.15%. RI's original "plan selection" number is actually a bit tricky because they deliberately purged some of their unpaid enrollments before submitting the figures to HHS in the first place, so it's not surprising that they have a higher "retention" rate.
- Vermont: +21.92%. What the heck??? How does Vermont manage to have nearly 35,000 fully paid/effectuated enrollees when they only had fewer than 32,000 as of late February? Yes, they extended their #ACATaxTime period through the end of May, but none of those should show up until the 2nd quarter. Vermont is the opposite of Hawaii in this scenario.
- Washington State: +12.89%. WA has the same explanation as Rhode Island, but more so. Washington only reports QHP selections to HHS after they've actually paid their first premium, so naturally they'll have a much higher "batting average" than most states.
Advertisement
