

UPDATED: King v. Burwell: How many people would lose tax credits in YOUR state??
Tue, 05/26/2015 - 11:20pm
Whenever I post about King v. Burwell, I have a tendency to lump all 34 states together into collective numbers (around 6.5 million losing their tax credits, plus another couple million being priced out of the market due to the resulting premium spikes, plus another 4-5 million having to pay through the nose to keep theirs).
However, I decided to break this out by individual state. First, I used the HHS Dept's. official ASPE report from March 10th. This includes all people who selected a QHP via HC.gov as of 2/22/15.
Next, I assume my standard 88% payment rate. Ironically, the higher this percentage is, the more people who could actually get royally shafted by a King plaintiff win.
Then, I estimate how many people will be enrolled in effectuated policies as of July 1st. That's important because of the churn factor--people are constantly enrolling and dropping their policies for unrelated reasons, even during the off season. I estimate that as of July, this will likely be around 2% fewer than the number who paid up (normal attrition would be more like 4% but that was partially cancelled out by the 147,000 people who enrolled via the Tax Filing Season special enrollment period via HC.gov). That brings the grand total down to around 7.4 million.
Next, we have to look at what percentage of enrollees are actually receiving federal tax credits in each of these states. The overall percentage is around 87%, but that varies from as low as 70% in New Hampshire to as high as 93% in Florida and Mississippi. That brings it down to around 6.43 million without NV/NM/OR or 6.63 million with them included.
With all that done, here's the state-by-state breakdown of how many people I expect will be receiving federal tax credits for their ACA exchange-purchased healthcare policy as of July 1st, 2015:
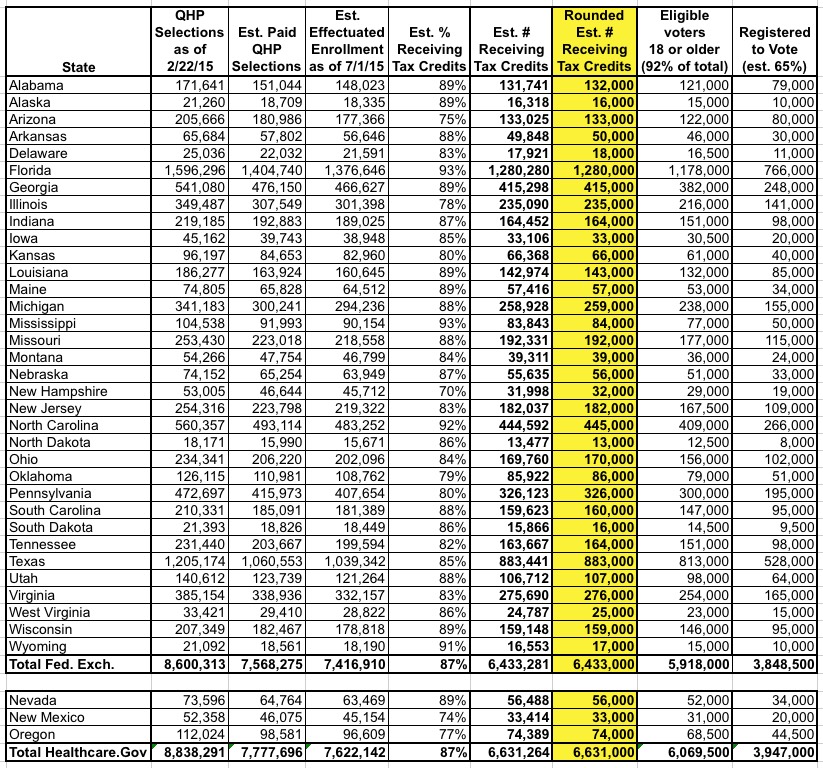
I should further note that this table only includes those who would actually lose existing Advance Premium Tax Credits (along with Cost Sharing Reduction assistance, in many cases). It does not include the 35-45% rate hike which the American Society of Actuaries warned would likely result for everyone else in the individual policy market.
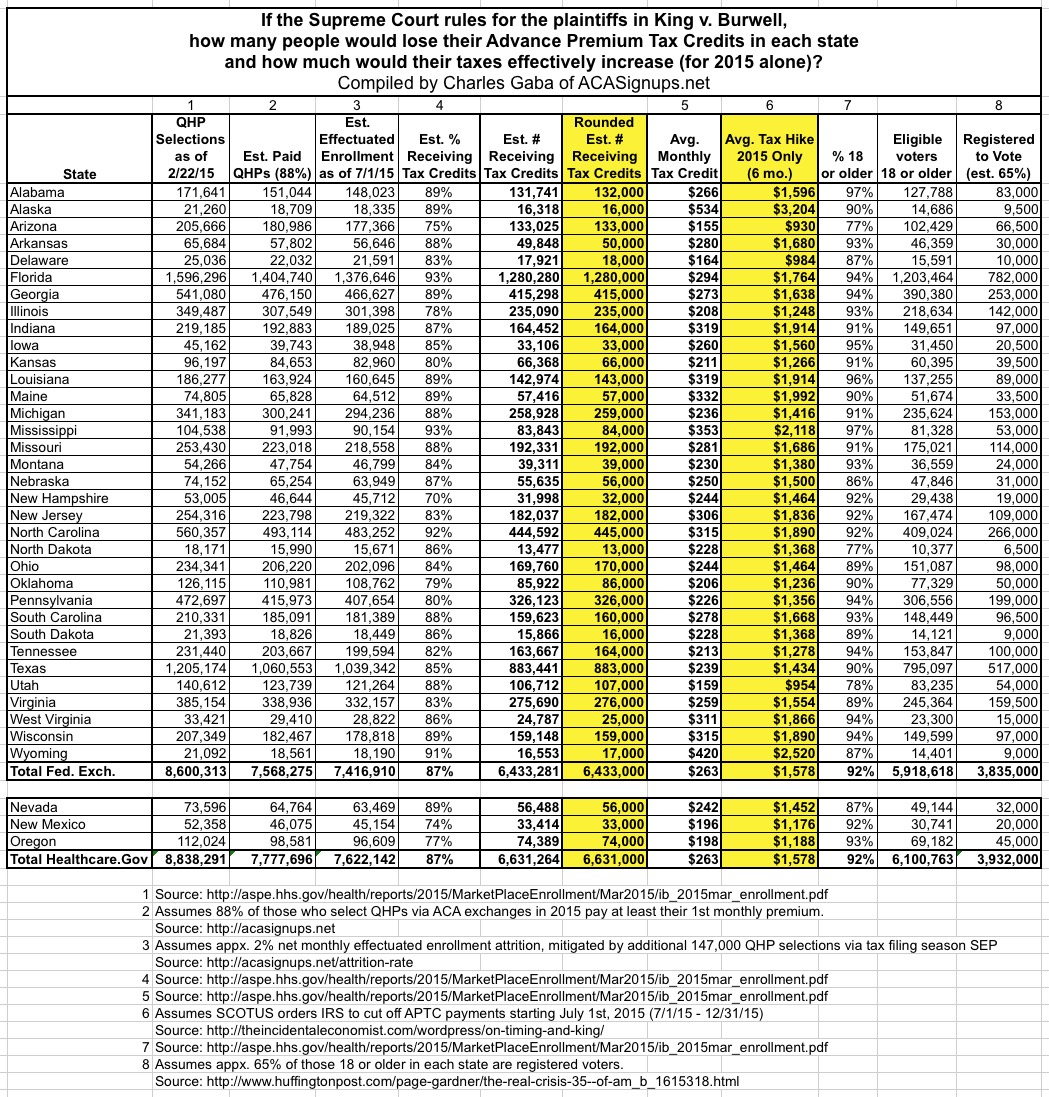
Boy, that's an awful lot of people who are gonna be furious starting in July if the Supreme Court starts making them cough up an extra $263 per month apiece (per person, I might add...a family of 4 might be looking at as much as $1,050 per month).
I wonder who they're gonna blame for that?
UPDATE: Just for the heck of it, I took this table two steps further to look at the potential political ramifications.
Around 8% of all enrollees are children under 18 and can't vote (although their parents would still be stuck with their share of the lost subsidies, of course!). Remove them and you're looking at around 5.9 million seriously angry potential voters.
Then, I tried to figure out how many of those folks are likely to actually be registered to vote. This is really tricky since voter registration varies widely by income level, age and so on. The best I could come up with was this 2012 article claiming that nationally, around 65% of eligible voters were registered. I have no idea how accurate that is in 2015, or in these states in particular, or within this subset of the population...but I'll go with it for the moment.
Assuming that 65% is fairly accurate, that's over 3.8 million registered voters who will be seriously PO'd if the King thing happens, and potentially as many as 5.9 million. If OR/NV/NM are included, it could possibly top 6 million.
UPDATE x2: OK, I've decided to take this to the next level. Below is a more comprehensive version of the table, including embedded source footnotes, a header and, most significantly, the actual dollar amount which enrollees in each state would lose every month in the event of a King plaintiff win. I also specified the percent of enrollees 18 and over by state instead of the 92% average.
It's not a pretty picture, but it's an important one. Feel free to repost the graphic itself widely as long as you link back to this entry.
BUT WAIT, THERE'S MORE!!
If you really want to get into the weeds on this, you can even find a rough estimate of how many people would lose their tax credits by county or even zip code!!
How? Well, the HHS Dept. has provided this handy (if huge) Excel spreadsheet file containing a breakdown of enrollments via Healthcare.Gov by zip code.
In addition, the folks over at Enroll America have already used this data to compile handy maps, broken out by county in each state.
These numbers correspond to the first column above. However, figuring out (roughly) how many of those people would actually lose their tax credits is pretty simple. Just divide the average percentage for that state into the total.
For instance, in Michigan, I estimate that around 259,000 people would lose their credits state-wide out of 341,000 who selected a policy via Healthcare.Gov this year. That's around 76%.
In Oakland County (where I live), according to Enroll America's map, 52,211 people selected a plan:
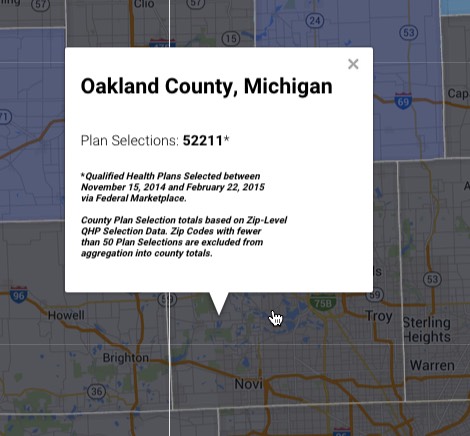
Assuming that the state-wide 76% ratio holds true, that means that in Oakland County, Michigan, around 40,000 people would lose their tax credits (including my wife and I, as it happens).
The state-wide percentage obviously will vary depending on what state you're in (it's over 80% in Florida, only 60% in New Hampshire), but you get the idea. Have fun!
Advertisement
