

The Slightly Revised Full Year 2015 Enrollment/Attrition Table
Tue, 04/21/2015 - 2:42pm
If you look at The Graph lately, you'll notice that in addition to extending the projections out for the full calendar year, I've also recently added the Effectuated Enrollment line, which hovers around the 10.0 - 10.1 million enrollee mark for most of the year.
I've explained this several times before, but with the recent confirmations from states like Idaho and Massachusetts that the 2015 payment rate is likely higher than the 88% "rule of thumb" that I've been using for nearly a year now, yesterday's data showing that the #ACATaxTime enrollments appear to be roughly 3,000/day nationally (I overestimated by a lot), and today's confirmation out of California that my estimate of at least 7,000 additional QHP selections per day during the "normal" off-season is likely underestimating things a bit, it seems like a good time to modify things.
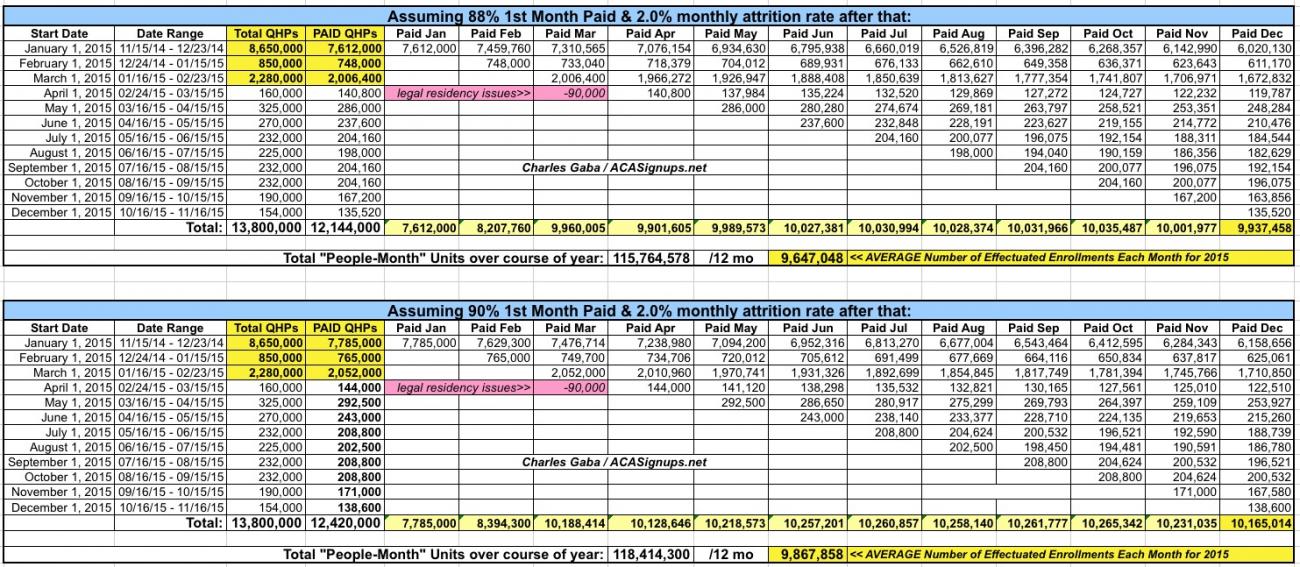
With that in mind, here's 2 tables which lay out how I expect the rest of 2015 ACA exchange enrollments and attrition to play out. The first table assumes that 88% of enrollees pay their 1st premium; the second table assumes 90%. Other than that, both are identical and assume:
- Roughly 7,500 people select QHPs per day during most of the off-season (dropping off substantially as we head into Nov/Dec). In 2014 it peaked at 10K/day but averaged around 7,600 for the full 7 month period from 4/15 - 11/15
- Roughly 2% of those already enrolled each month drop their coverage for various reasons (life changes, etc.). In 2014 it was closer to 3%; I'm assuming the retention rate will be slightly higher this year, but you never know.
As you can see, with 88% paying, monthly effectuations should hover somewhere between 9.9 - 10.0 million each month through the end of the year. With 90% paying, they should be float somewhere between 10.1 - 10.3 million. On the Graph I've split the difference and am assuming between 10.0 - 10.1 million for the remainder of 2015.
(For the record, at 88% and 3% attrition, the numbers would gradually slide from a high of 9.8 million down to around 9.1 million by the end of the year. On the other hand, at the high end, at 91% & just 1.5% attrition, we'd be looking at 10.4 million today rising to over 10.8 million by December, so there you go.)
Of course, all of this also assumes that there aren't any further "bulk cancellations" due to legal residency issues/etc. along the lines of what happened at the end of February.
Finally, this also assumes that the Supreme Court doesn't blow everything up starting in July with their King v. Burwell ruling. If they do, then all bets are off and everything below is meaningless.
(note: you can see the full-size tables here)
Advertisement
