

California: 22.6K QHPs via #ACATaxTime, 52.1K via Life Changes, 7K/day nationally confirmed
Tue, 04/21/2015 - 10:18am
A huge thank you to Hannah Recht for the link to last week's Covered California board meeting dashboard report, which contains this crucial slide:
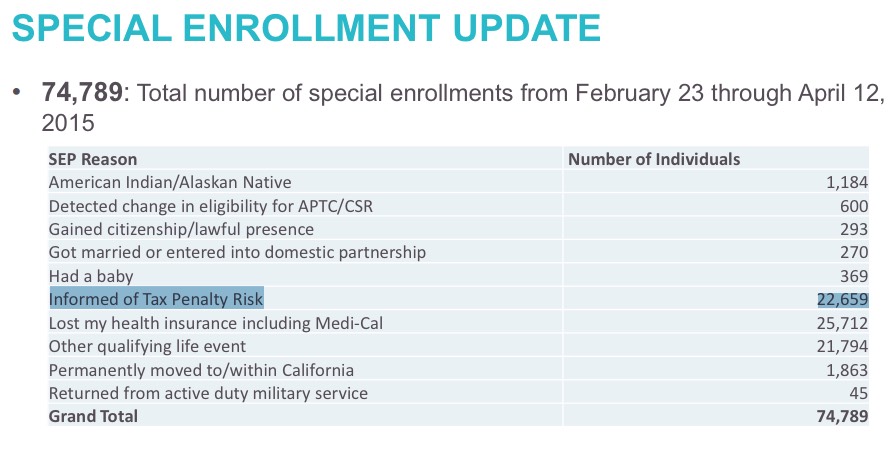
This is incredibly useful! Not only have they given an updated #ACATaxTime tally (22,659 as of 4/12, up from 18,000 as of 4/05), but they've also given the other off-season QHP enrollments for California since Open Enrollment ended. As a bonus, they've even broken out those other QHPs by the specific reason, which is a first for any exchange report, I believe!
As an aside, the report also confirms that around 15,644 employees were enrolled in SHOP (small business) policies as of March 1st, a bit lower than the 16,000 round-figure given a month or so ago. Assuming 2.5 covered lives per employee enrolled, that means CA should have around 40K total covered lives via SHOP.
So, let's see here:
- That's around 4,659 more tax penalty-related QHPs since 4/05, or around 665/day. Unlike HC.gov, that's an increase in the daily rate. However, both the "18,000" and the exact thru-date (4/05) are estimates, so it might not be that much of a bump...plus, CA's #ACATaxTime started immediately after open enrollment (2/23) whereas HC.gov's didn't start until 3/15, so it's not quite a fair comparison.
- In addition to the 22.6K tax-related QHPs, CA is reporting an additional 52,130 "normal" off-season QHPs via Life Changes. In addition to letting me update California on the spreadsheet and The Graph, this also helps give a guideline for how accurate my estimate of at least 7,000/day national off-season QHPs is, as follows:
- 52,130 from 2/23 - 4/12 = 52,130 / 49 days = 1,064 per day
- This year, California made up just over 12% of the national total of 11.69 million QHP selections during open enrollment
- Assuming CA's off-season average is similarly representative, that should mean that off-season QHPs nationally have been around 8,900 per day!
Before people look at this and say that I'm underestimating the off-season average, let me explain: For 2014, I had estimated that around 9,000 people per day were enrolling during the off-season nationally, and I stand by that this year. However, as I noted yesterday, I've lowered my off-season estimate to 7,000/day to be on the safe side:
- California may be over-representing here, just as they're over-representing on the #ACATaxTime enrollments (for instance: 22,659 = 1.6% of their open enrollment total. For HC.gov, 68,000 = just 0.77% of their 8.84 million QHPs).
- There may be another one-time "purge" of enrollees who failed to provide proper legal residency documentation (this has happened twice so far: 112,000 were kicked off their policies back in September 2014, and another 90,000 in February of this year)
- Finally, that 9K/day average last year dropped off substantially as the 2015 open enrollment period approached, bringing the full year average down to just 6,300 per day by the end of the year.
In other words, this news out of California strongly supports my estimate that at least 7,000 people are enrolling nationally every day, during the off-season, not including the #ACATaxTime SEP.
What this also means is that, while the confirmed QHP selection total to date now stands at 11,864,835, I'm virtually certain that the total to date is actually around 12.2 million.
Finally, the breakout of the reasons for the additional 52,130 enrollments is interesting as well. Again, I have no idea how representative CA is of the nation at large; the American Indian/Alaskan Native ratio, for example, is likely much higher in some states than others. However, here's how it's breaking out in CA so far:
- Lost Existing Coverage: 49.3%
- American Indian/Alaskan Native: 2.3%
- Moved to/within California: 3.6%
- "Detected Change in Eligibility for APTC/CSR": 1.1%
(I assume this basically means "major loss of income" bringing them down below the 400% cap on tax credits?) - Gained Citizenship/Lawful Presence: 0.6%
- Got Married/Domestic Partnership: 0.5%
- Gave Birth: 0.7%
(I'd think this includes adopting a child/foster caring for a child?) - Returned from Active Duty Military Service: 0.1%
- "Other": 41.8%
The fact that nearly 42% are listed as "other" makes this breakout less useful than it would otherwise be, but it's still better than nothing. The only official changes not listed are adoption/foster care (which I doubt make up a huge number) and being released from prison, which I also suspect doesn't make up a large percentage. Presumably most of the "Other" are actually one or more of the other listed options.
Advertisement
