

State by State: How much more will YOU pay if the enhanced ACA subsidies aren't extended? (Alabama - California)
Wed, 06/19/2024 - 5:11pm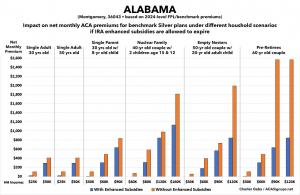
It was just over three years ago that the American Rescue Plan Act (ARPA) dramatically expanded & enhanced the original premium subsidy formula of the Affordable Care Act, finally bringing the financial aid sliding income scale up to the levels it should have been in the first place over a decade earlier.
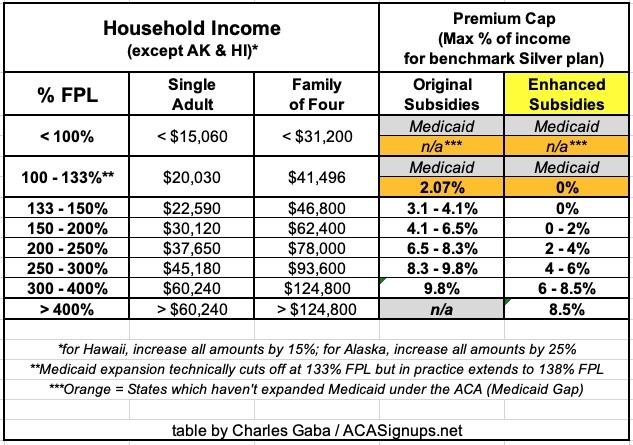
In addition to beefing up the subsidies along the entire 100 - 400% Federal Poverty Level (FPL) income scale, the ARPA also eliminated the much-maligned "Subsidy Cliff" at 400% FPL, wherein a household earning even $1 more than that had all premium subsidies cut off immediately, requiring middle-class families to pay full price for individual market health insurance policies.
Here's what the original ACA premium subsidy formula looked like compared to the current, enhanced subsidy formula:
Unfortunately, the ARPA's subsidy enhancements included a major caveat: They were only in place for three years, originally scheduled to terminate effective December 31, 2023 (they were retroactive to the beginning of 2021).
The good news is that this sunset date was bumped out by another two years as part of the Inflation Reduction Act (IRA) passed in 2022. The bad news is that this extension is currently scheduled to end effective December 31, 2025. Needless to say, with a divided Congress, Republicans are unlikely to be inclined to extend the IRA's enhanced subsidies further, especially in the middle of a Presidential election year.
A coalition of stakeholders including Families USA, the Alliance of Community Health Plans and others have been lobbying Congress to bump out the enhanced subsidies by at least one year, while the Congressional Budget Office just posted new projections about the impact of the IRA subsidies expiring on health insurance coverage in the U.S. over the next decade...and it's not pretty:
By CBO’s estimates, the share of people without health insurance reached an all-time low of 7.2 percent in 2023. The rate in 2034 is projected to be 8.9 percent—higher than it was during the 2021–2023 period but lower than the rate of 10.0 percent in 2019, before the coronavirus pandemic. CBO attributes much of the increase over the next 10 years to the end of Medicaid’s continuous eligibility provisions in 2023 and 2024 and the expiration of enhanced marketplace subsidies after 2025. (Both of those policies were put in place during the pandemic.)
An increase of 1.7 percentage points may not sound like much, but that's around 5.8 million people. More specifically, the CBO projects that ACA exchange enrollment would drop from an all-time high of 23 million next year down to just 16 million by 2027, where it would remain for the foreseeable future.
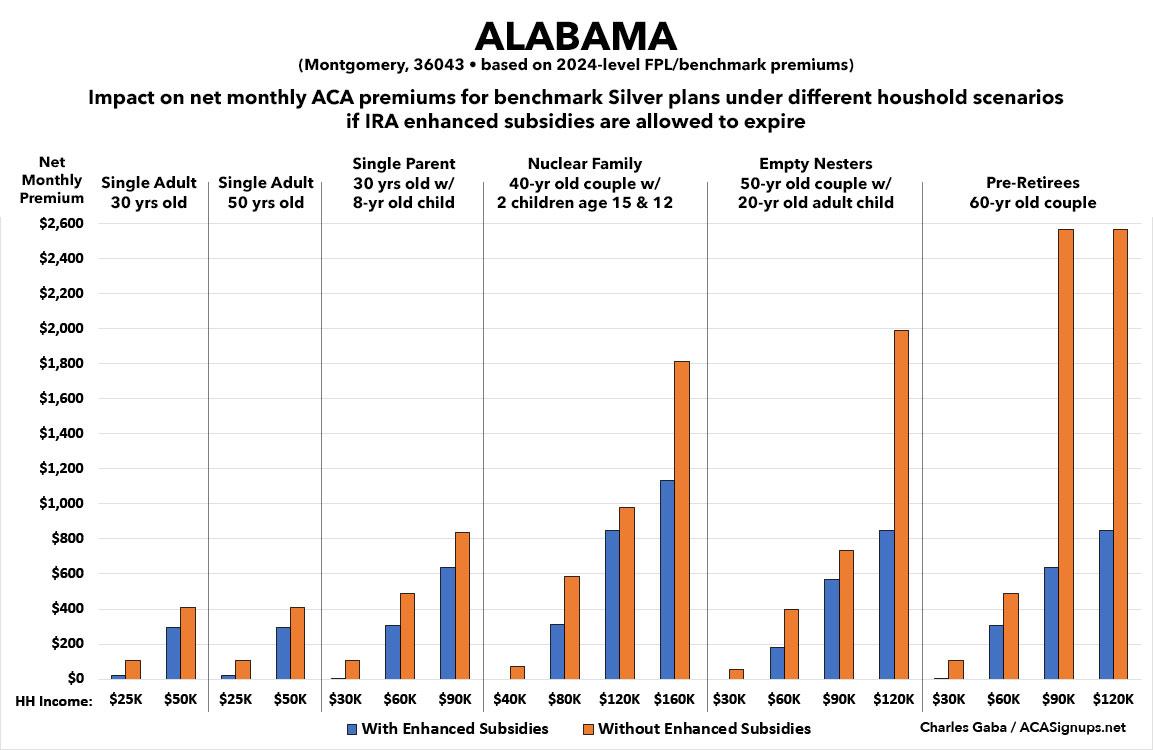
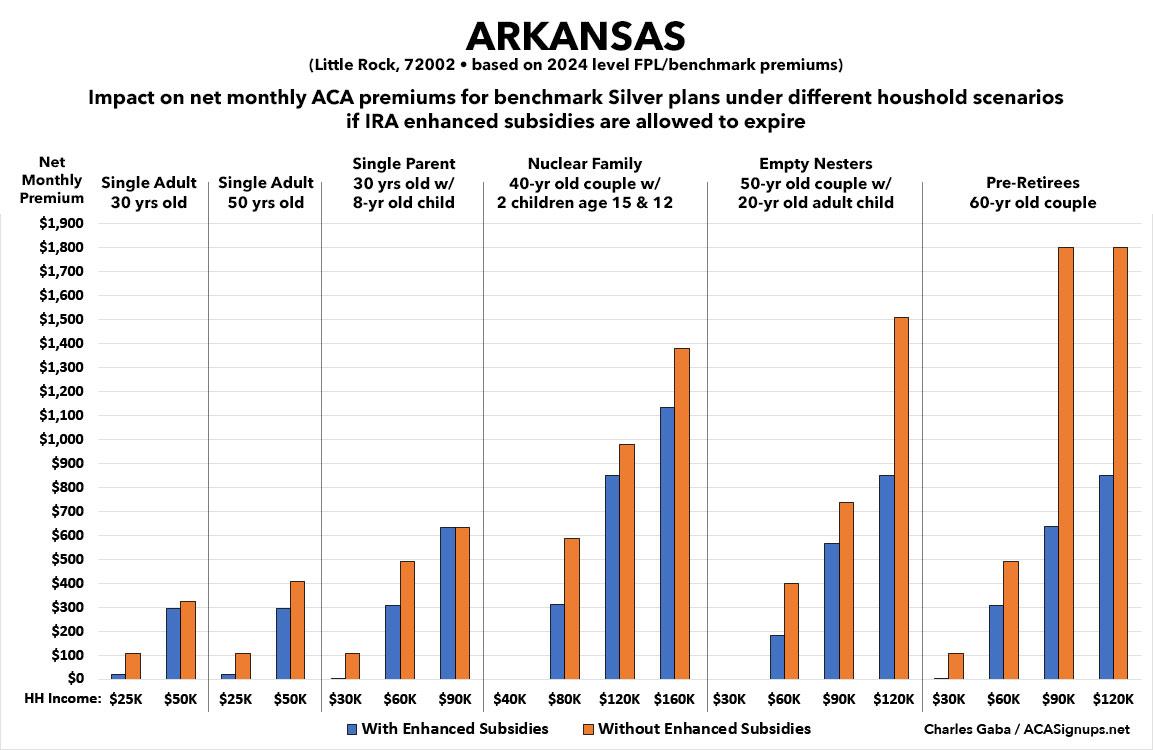
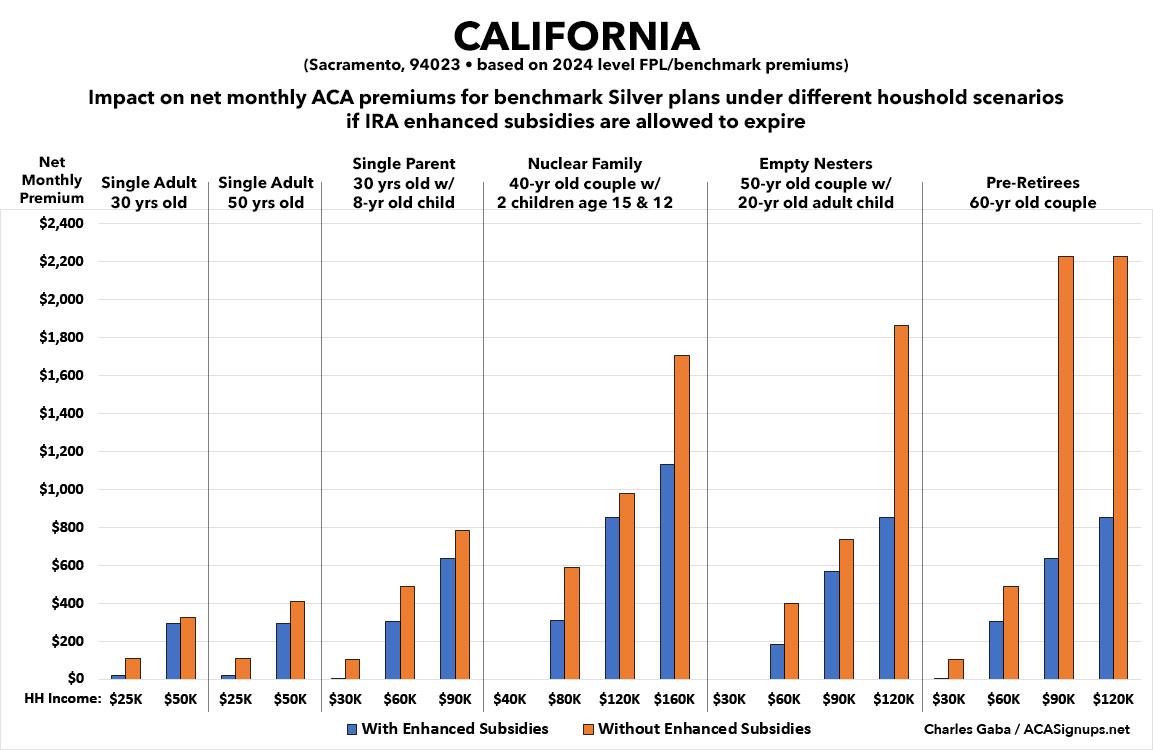
That's the macro level, however. As I did a couple of years ago when the subsidies were originally at risk of expiring in 2023, I decided to run the numbers myself to get an idea of just how much enrollees real-world health insurance premiums would go up in the event the ARPA/IRA subsidies are indeed allowed to expire at the end of next year.
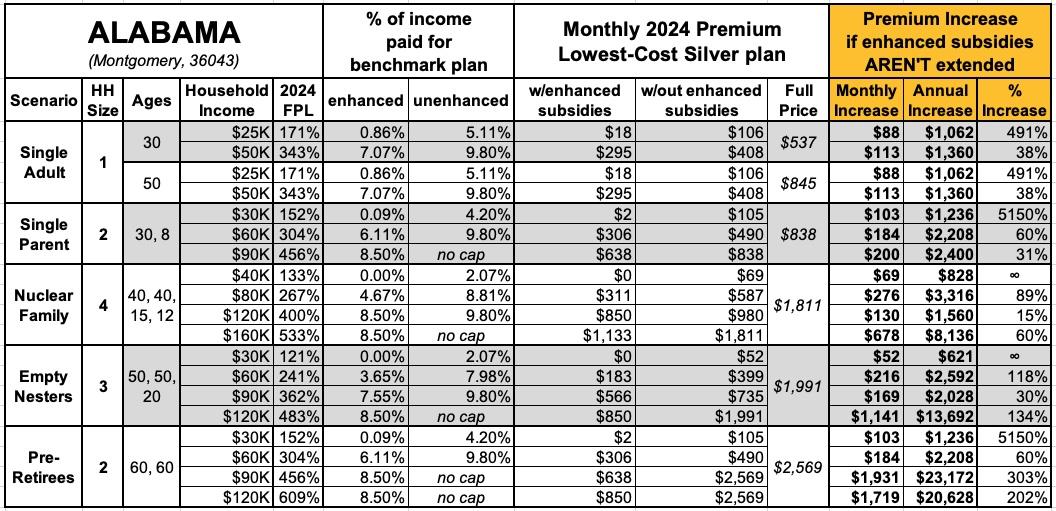
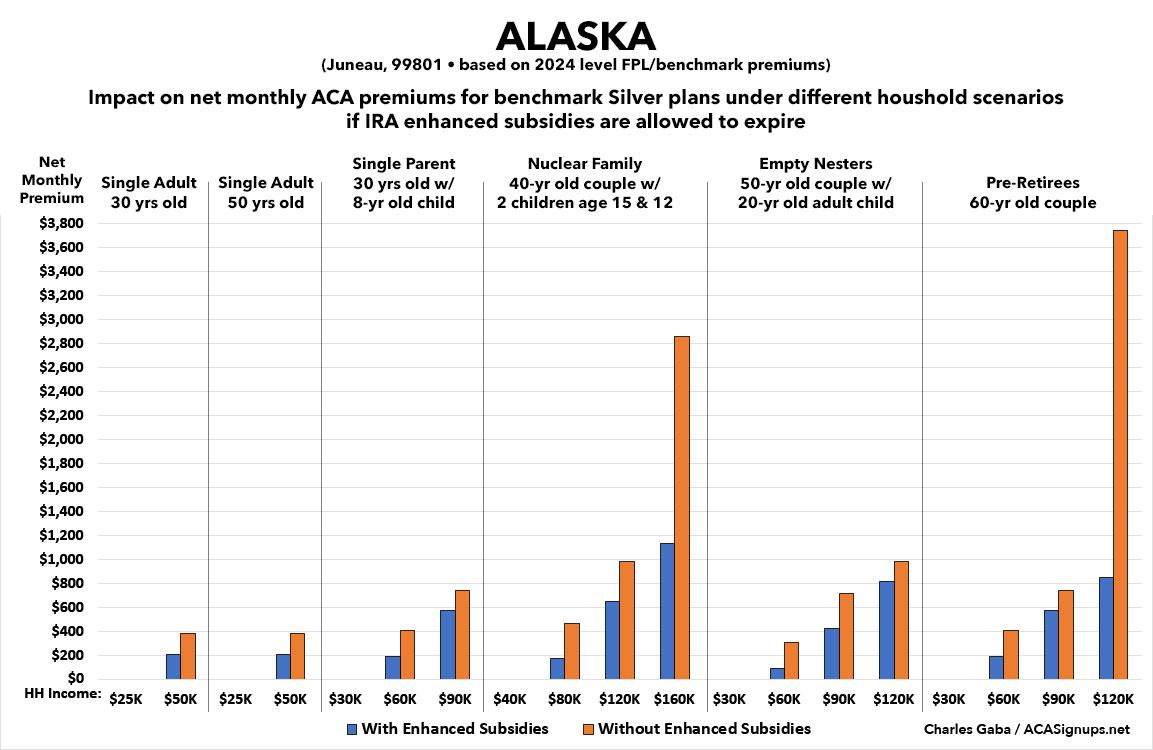
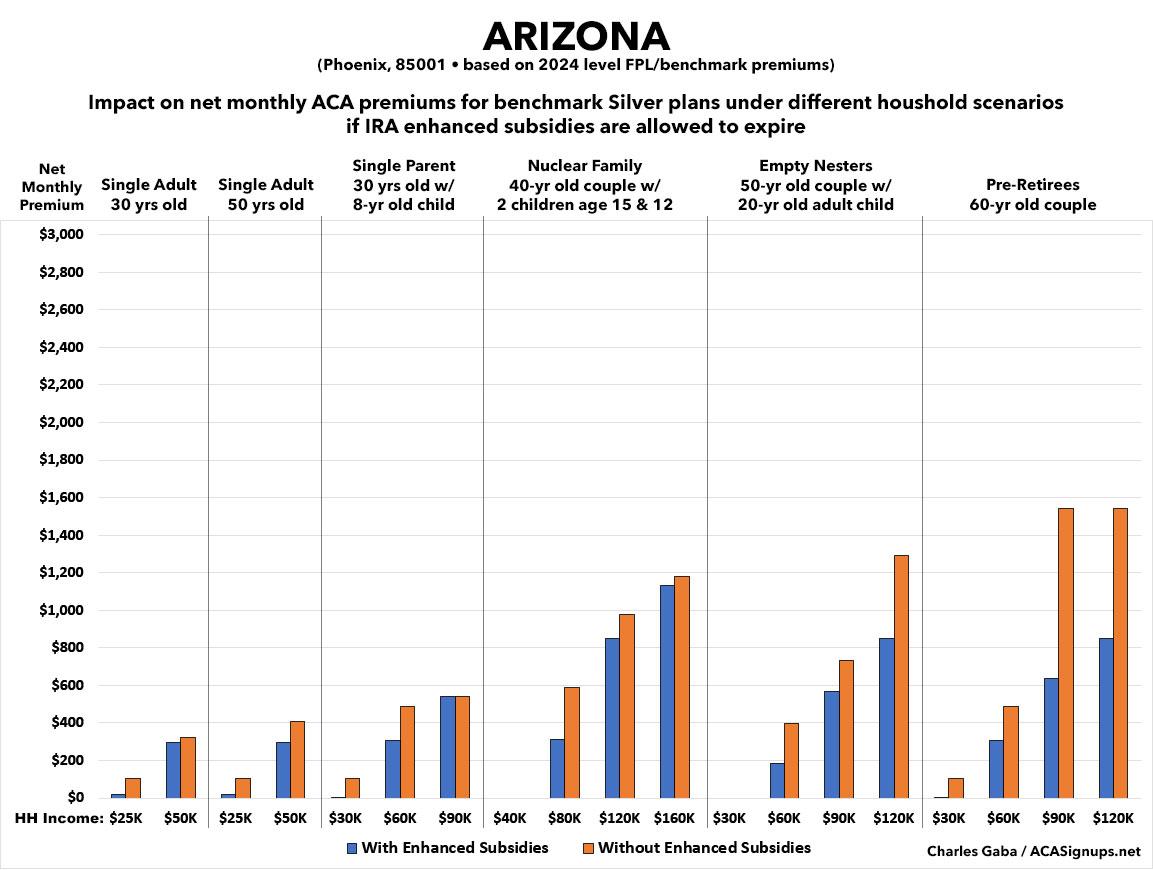
For this analysis, I'm using five different household scenarios, at several different income levels for each:
- 30-yr old single adult earning $25K or $50K/year
- 50-yr old single adult earning $25K or $50K/year
- 30-yr old single parent w/an 8-yr old child, earning $30K, $60K or $90K/year
- 40-yr old couple w/2 children age 15 & 12, earning $40K, $80K, $120K or $160K/year
- 50-yr old couple w/1 adult child age 20, earning $30K, $60K, $90K or $120K/year
- 60-yr old couple earning $30K, $60K, $90K or $120K/year
There's several caveats involved here.
- First, it's important to keep in mind that the only hard numbers for the Federal Poverty Level and average Benchmark Silver ACA premiums are as of 2024. By 2026, the first year that the impact of the enhanced subsidies ending would actually go into effect, each of thse would be higher...perhaps 5% or so for the FPL and by varying amounts for benchmark premiums in each state.
- Next, it's important to keep in mind that the benchmark Silver premium varies widely from state to state, Rating Area to Rating Area, county to county and potentially even from zip code to zip code in some states. Not every plan is offered throughout an entire rating area, which can impact which Silver plan is considered the Benchmark for that area.
With that in mind, I'm picking a single zip code for each state...and I'm using the capital city of each state to do so. Note that the capital is also the largest city in some states but not in others.
- "Single Parent" and "Nuclear Family" scenarios: In some states, children under 19 are eligible for CHIP or Children's Medicaid at a significantly higher household income level (in some states they're eligible up to 200% FPL or more). The analyses below don't take that into account.
- These analyses assume that the enrollees choose the benchmark Silver plan. In many cases they'd be better off choosing a Gold or Bronze plan (or even Platinum, although those aren't even available in most states).
-
Finally, these analyses don't take into account the state-based supplemental financial subsidies available in about a dozen states.
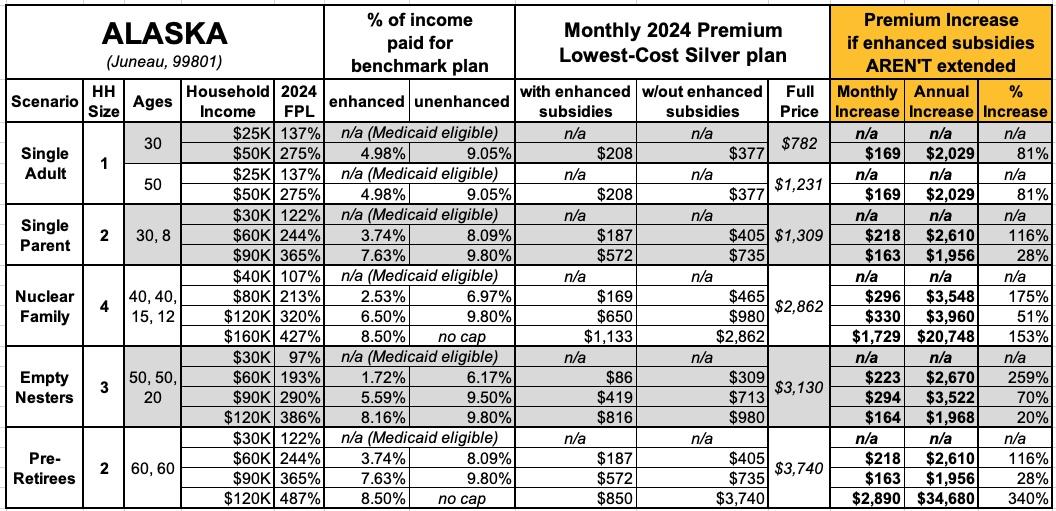
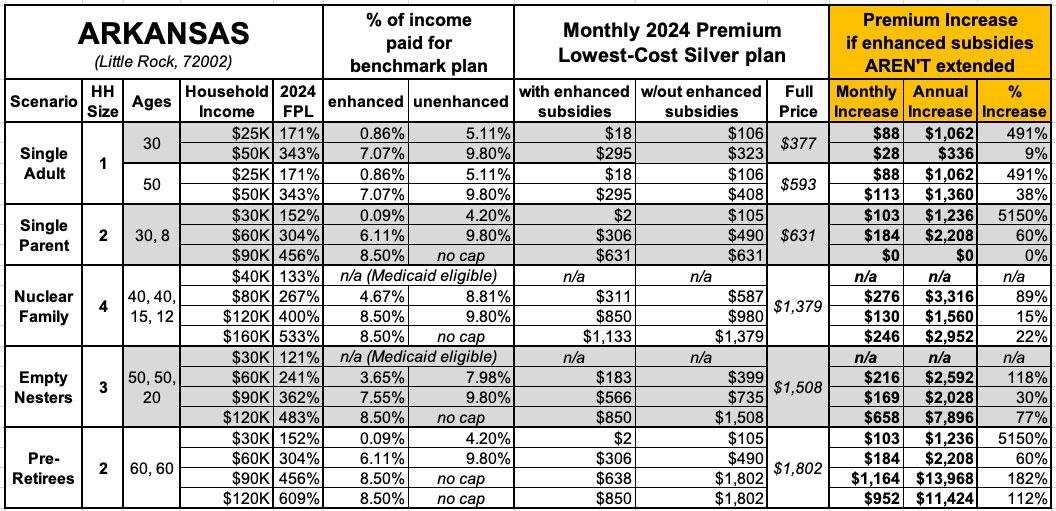
OK, with all that understood, let's take a look (note: the infinity (∞) sign simply means that the net monthly premium for that household would go from $0 (free) to some number higher than $0...which technically means their premium would increase "infinity percent" even if it only went from $0 to $1/month.
NOTE: Given the high number of graphs/tables involved, I'm breaking this into 10 posts of 5 states apiece (I'll include DC with the 2nd batch).


Advertisement
