

Weekly Update: Which COUNTIES have the highest per capita rates of #COVID19 cases and deaths?
Sat, 12/12/2020 - 1:28pm
The data below comes from the GitHub data repositories of Johns Hopkins University, except for Utah, which comes from the GitHub data of the New York Times due to JHU not breaking the state out by county but by "region" for some reason.
I've made some more changes:
- I've now completed updating the partisan lean for every county except Alaska (I'm having trouble getting that broken out by "County-Equivalent Region") to the 2020 Biden/Trump results. Alaska still uses the Clinton/Trump 2016 results, although I can't imagine more than one or two regions changed status there this year.
- I've also added columns listing the actual Biden/Trump vote percentage for each county to give a feel for how partisan it is. Again, I'm defining "Swing District" as any county where the difference is less than 6.0%. There's 188 swing districts (out of over 3,100 total), with around 33.8 million Americans out of 332 million total, or roughly 10.2% of the U.S. population.
- Finally, new this week: I've added all of the U.S. territories, including a county-equivalent breakout for Puerto Rico, as well as American Samoa, Guam and the U.S. Virgin Islands. None of these vote in the general Presidential election, of course, but I'm still tracking their COVID-19 case & death rates. None show up in the top 100 of either ranking, however.
With these updates in mind, here's the top 100 counties ranked by per capita COVID-19 cases as of Friday, December 11th (click image for high-res version).
Blue = Joe Biden won by more than 6 points; Orange = Donald Trump won by more than 6 points; Yellow = Swing District
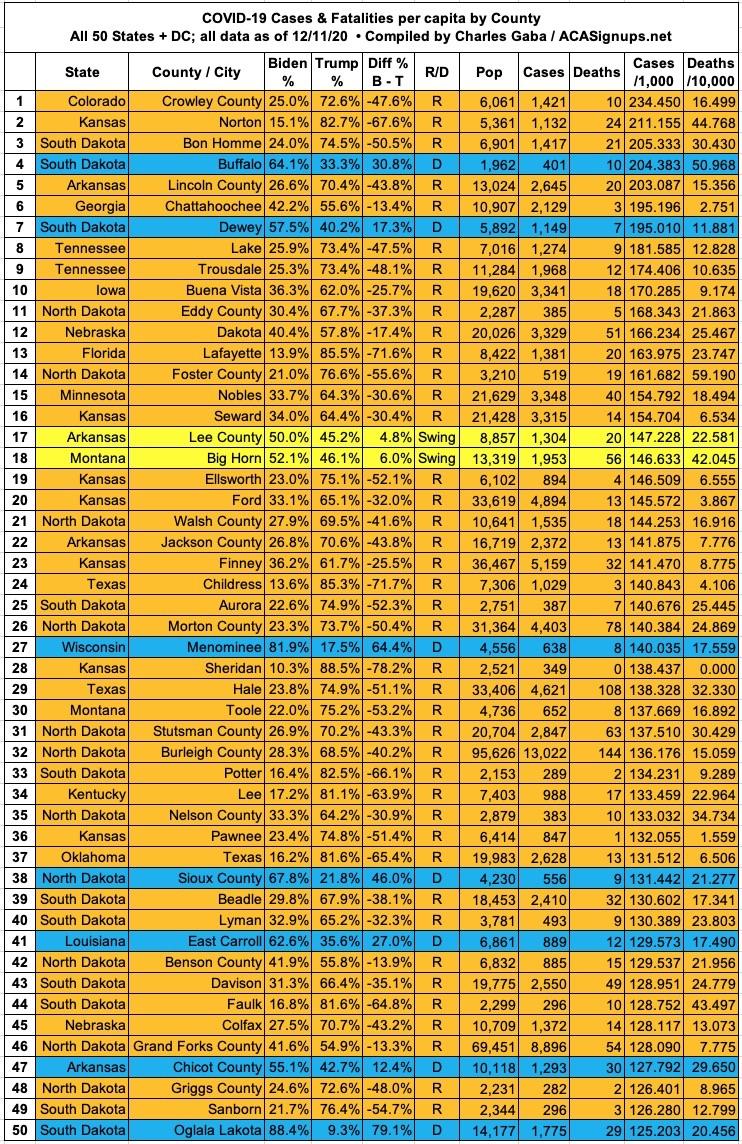
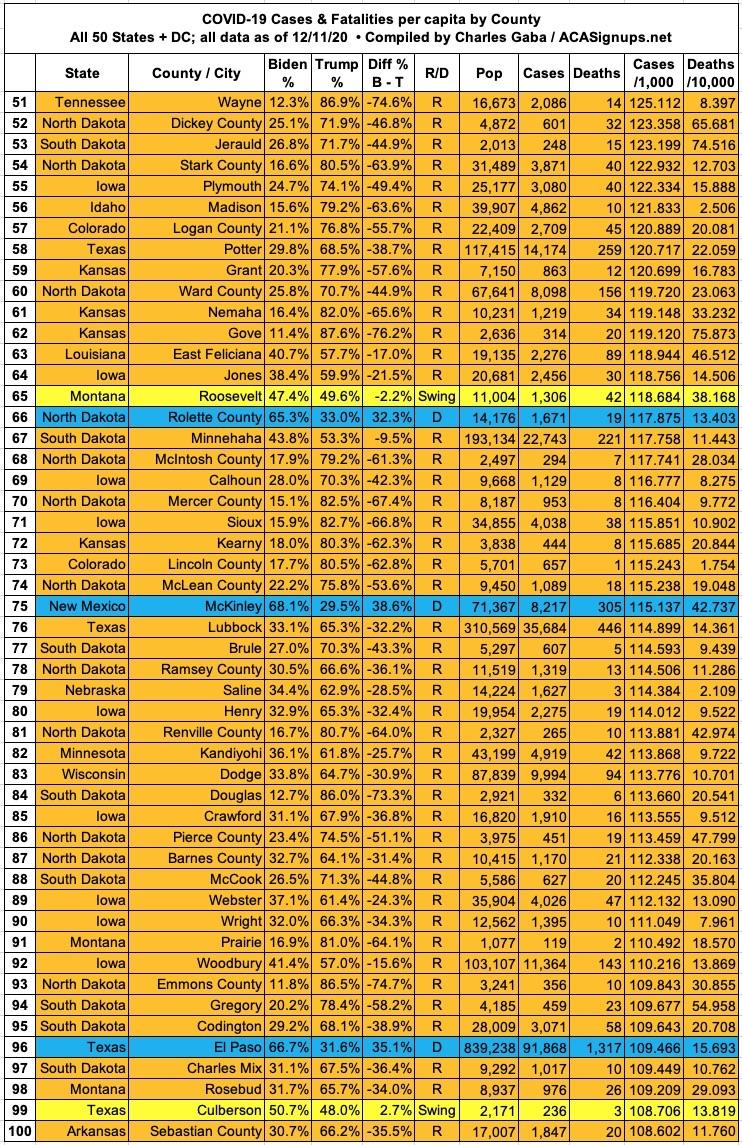
Crowley County, Colorado still holds the #1 spot. 1,421 of their 6,061 residents have now tested positive for #COVID19, or 23.4% of their total population.
88 of the top 100 counties were won by Donald Trump in 2020.
For comparison, 2,587 counties voted for Trump out of 3,142 total (82.3%), although only 2,496 of them voted for him over Biden by more than 6 points, or 79.4%.
Here's the top 100 counties ranked by per capita COVID-19 fatalities as of Friday, December 11th (click image for high-res version):
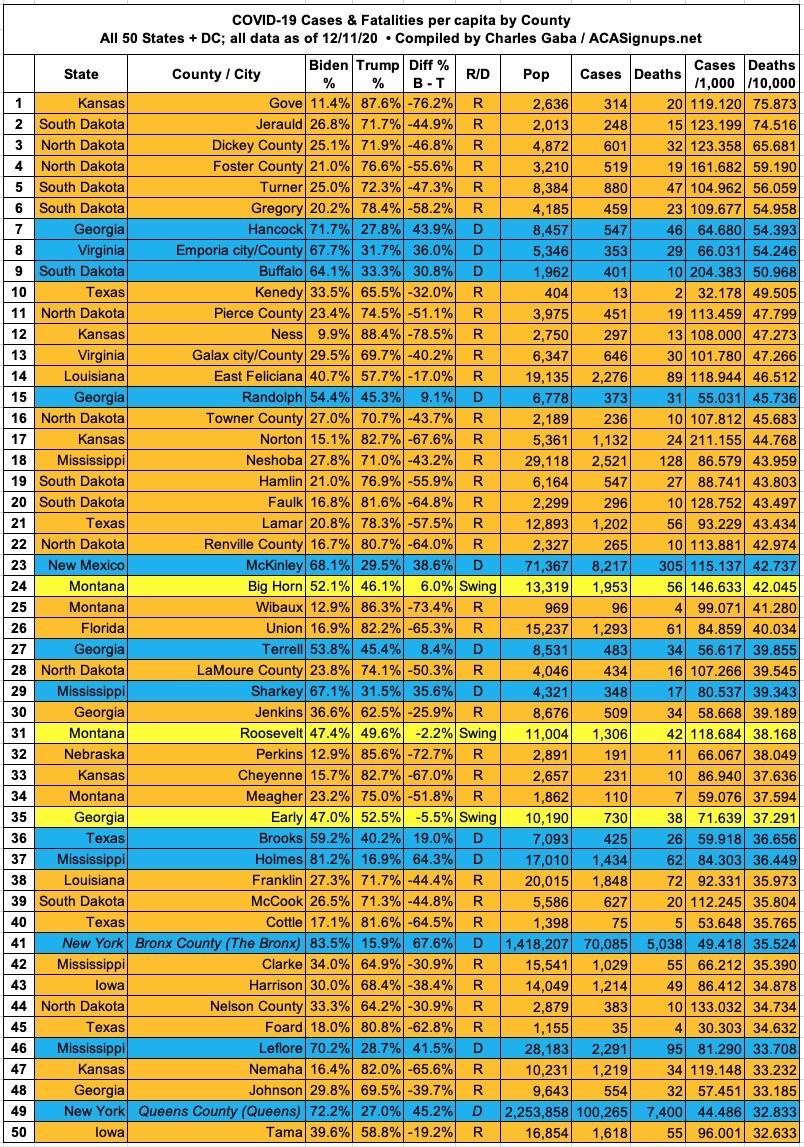
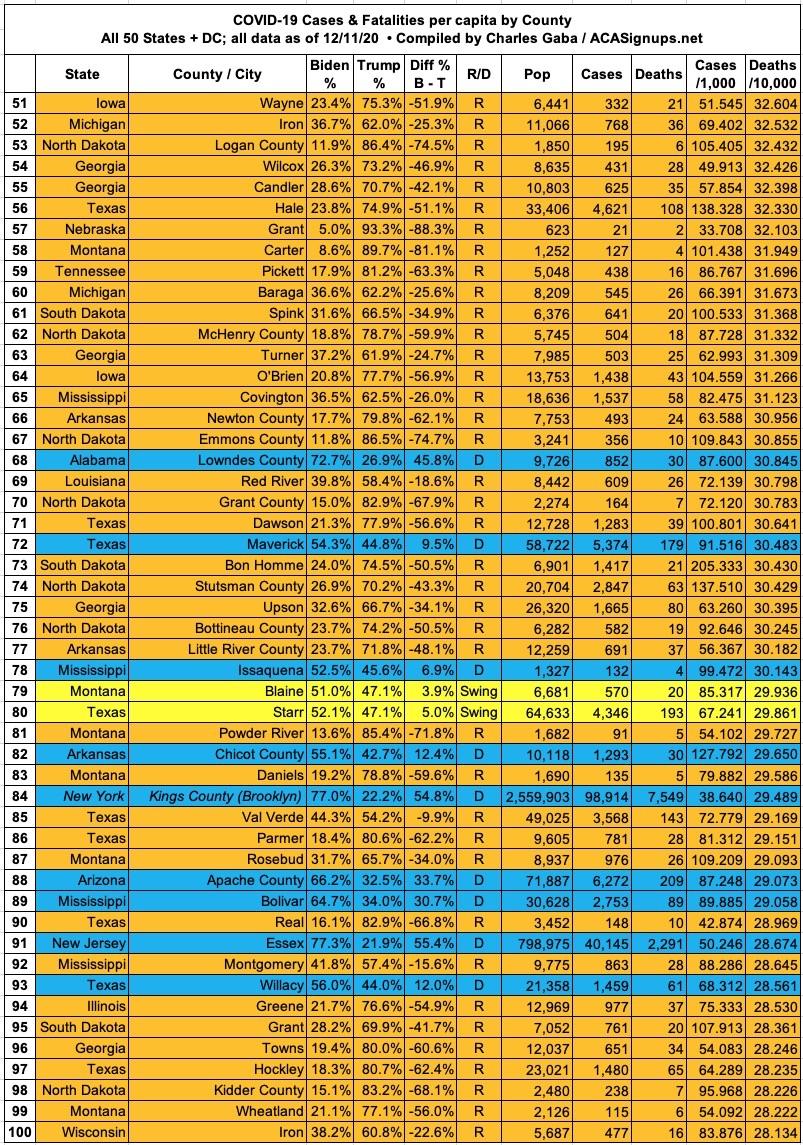
The #1 spot is still held Gove County, Kansas, where 20 of the county's 2,636 residents have died of COVID-19, or 0.76%. That's 1 out of every 132 residents.
76 of the top 100 counties voted for Donald Trump in 2020.
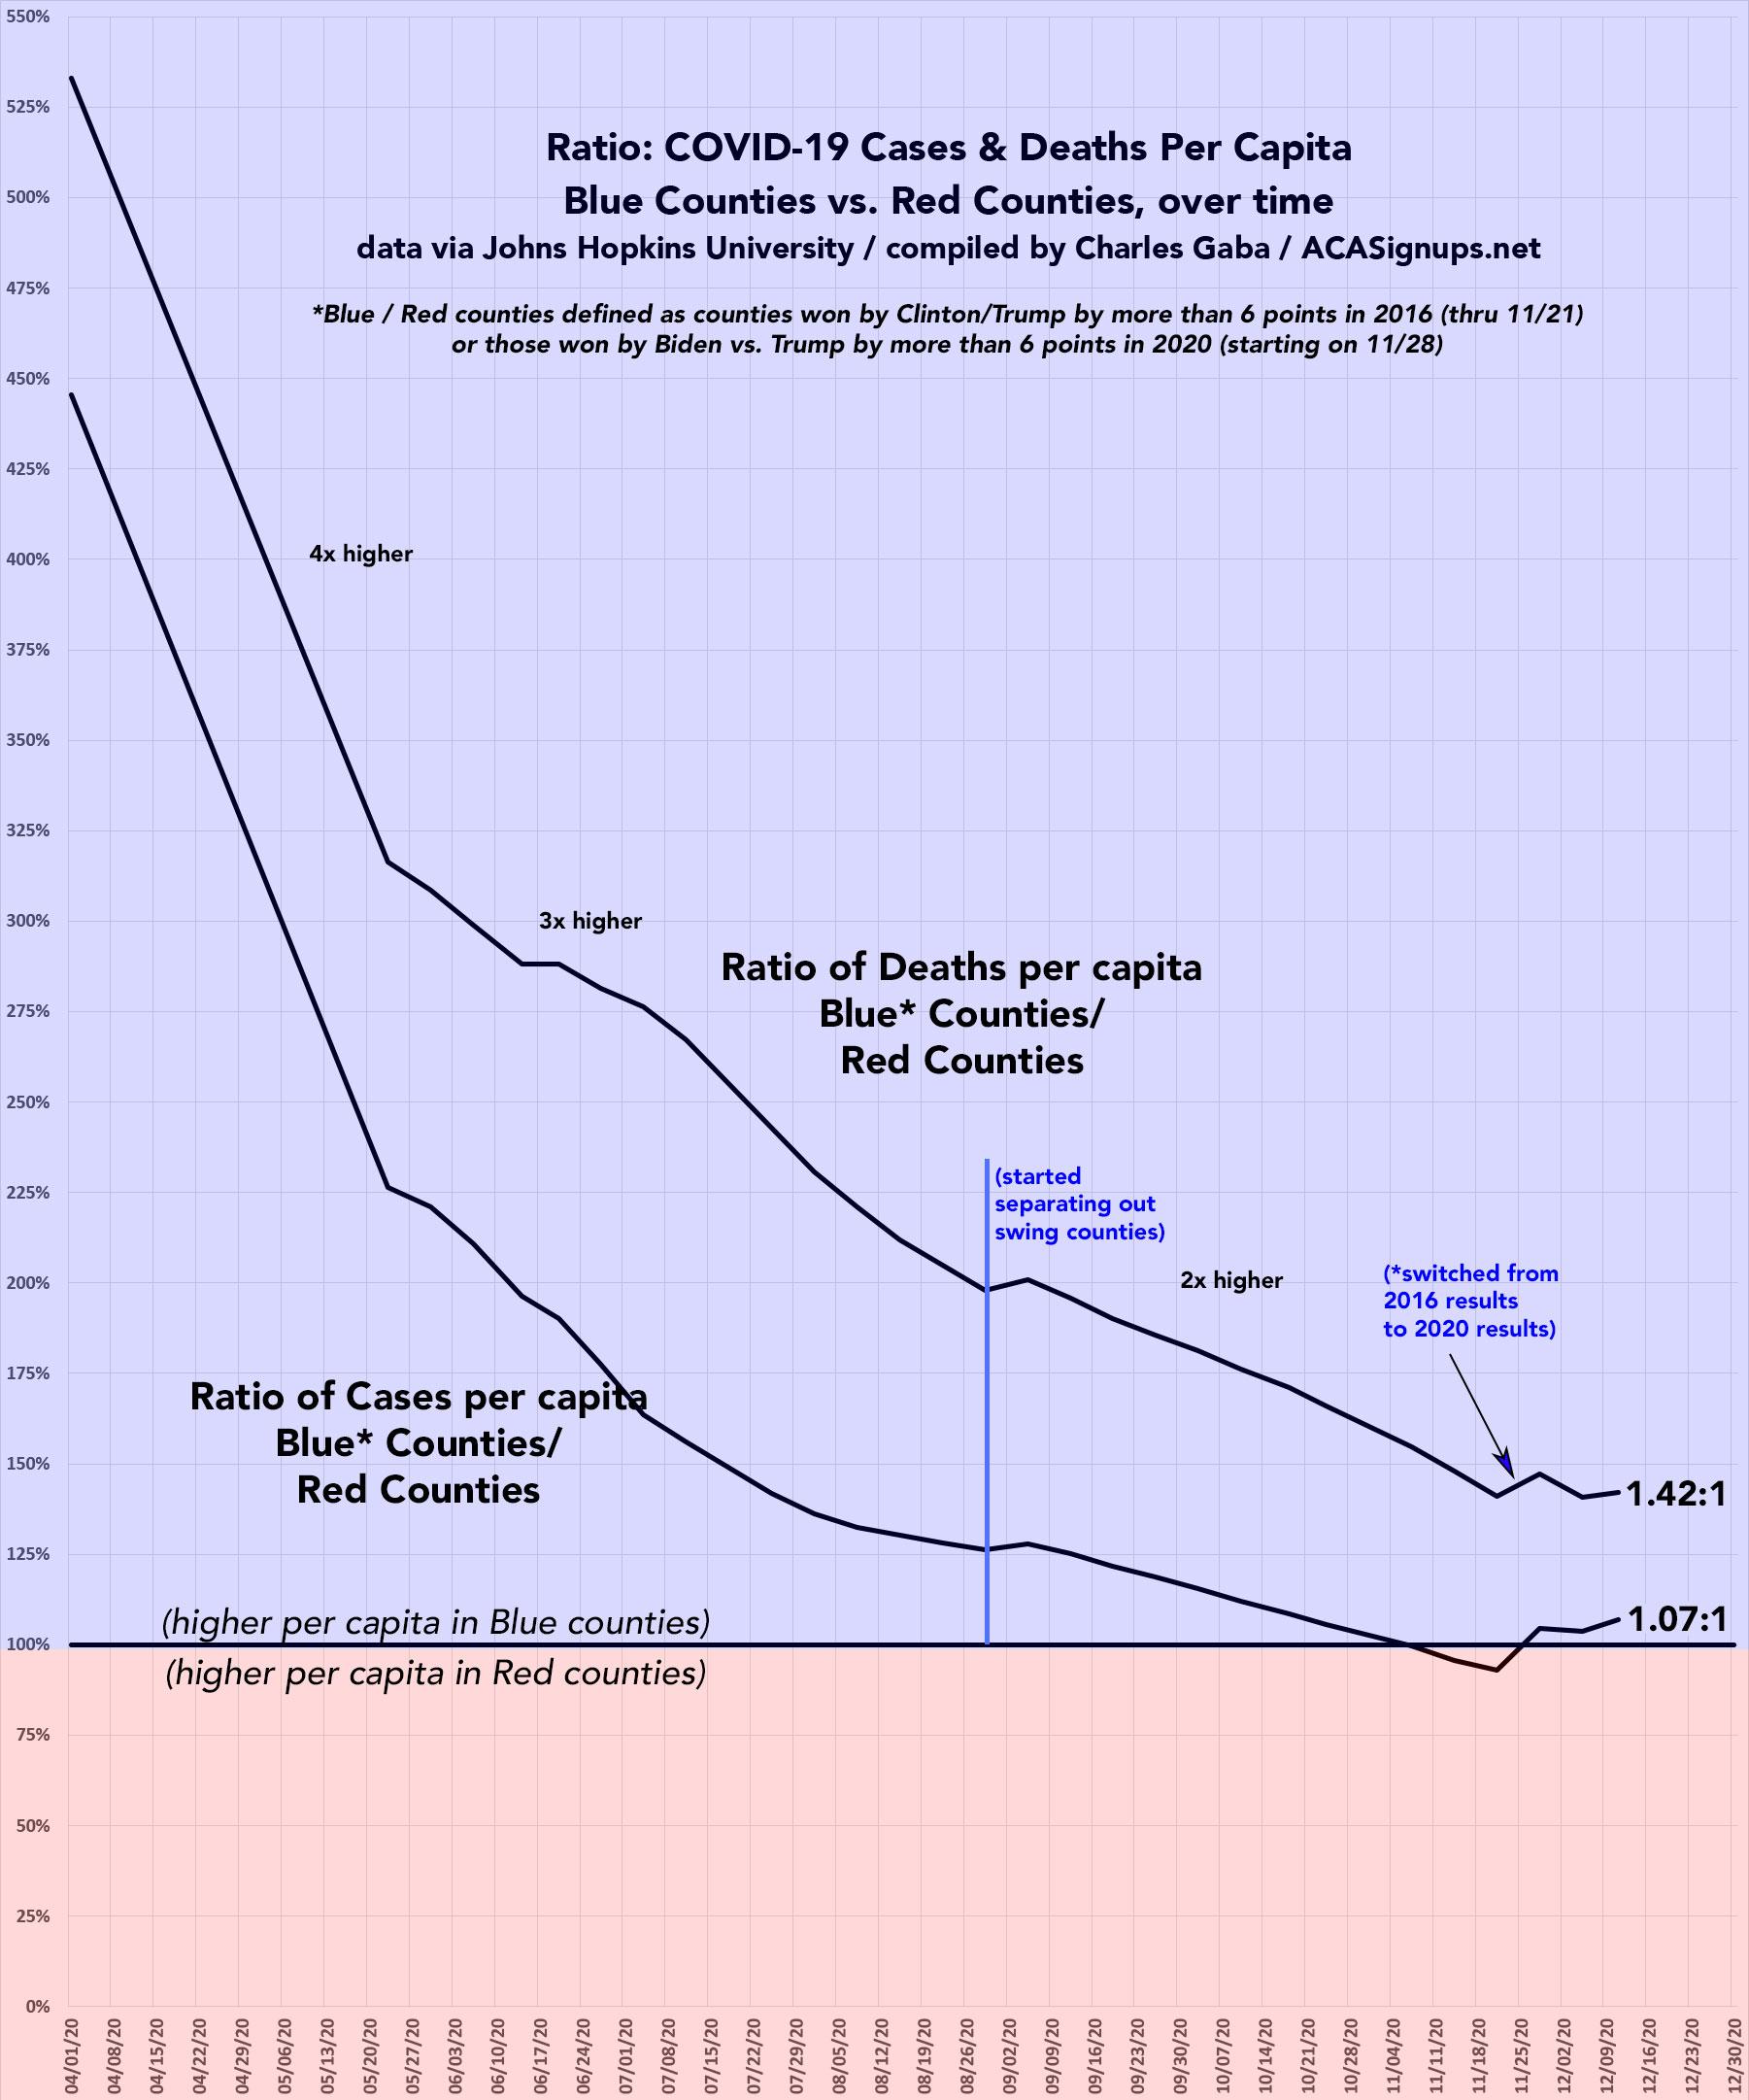
It's also worth noting how the ratio of per capita cases and mortality have shifted between the Blue and Red-leaning counties over time.
Back in mid-March, the case rate was 450% higher and the mortality rate was 530% higher in blue counties than red counties (defined as counties which voted for Hillary Clinton or Joe Biden vs. Donald Trump). Due to my updating most of the counties to reflect the 2020 results instead of 2016, the lines for both cases and deaths per capita have jumped back towards the "blue" side a bit. Even so, cases per capita are still just 7% higher in the blue counties now, and the mortality rate is still down to just 42% higher.
We'll see whether the trend towards a higher rate in Trump counties continues going forward. It's jumped around the past couple of weeks but that could be because I it took me 3 weeks to update every state from 2016 to 2020 red/blue lean status:
I've also taken a look at the counties with the lowest rates of COVID-19 cases and fatalities:
- There are now just 124 counties nationwide which haven't reported any COVID-19 deaths as of yet, down from 140 a week ago.
Total combined population of these 124 counties? 663,000 people.
- There are only 3 counties nationwide which haven't reported any cases yet:
- Bristol Bay Borough, Alaska
- Hoonah-Angoon Census Area, Alaska
- Kalawao County, Hawaii
Total combined population of these 3 counties? 3,070 people.
Advertisement
