

Weekly Update: Which COUNTIES have the highest per capita rates of #COVID19 cases and deaths?
Mon, 11/02/2020 - 1:10pm
The data below comes from the GitHub data repositories of Johns Hopkins University, except for Utah, which come from the GitHub data of the New York Times due to JHU not breaking the state out by county but by "region" for some reason.
Note that a few weeks ago I finally went through and separated out swing districts. I'm defining these as any county which where the difference between Donald Trump and Hillary Clinton was less than 6 percentage points either way in 2016. There's a total of 198 Swing Counties using this criteria (out of over 3,200 total), containing around 38.5 million Americans out of over 330 million nationally, or roughly 11.6% of the U.S. population.
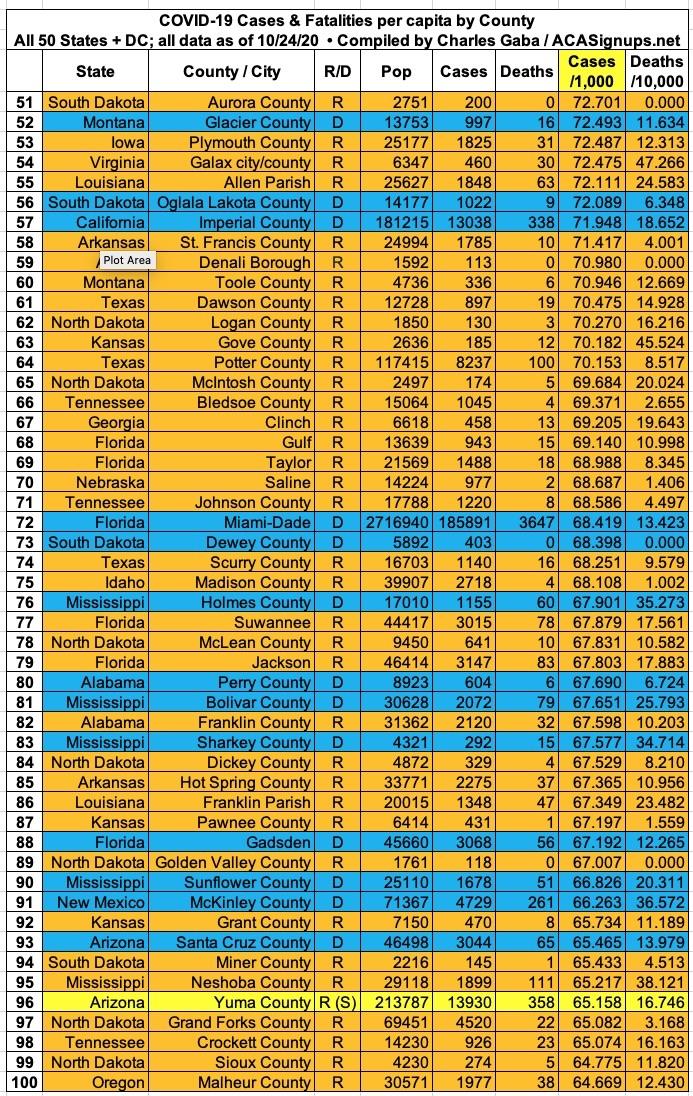
With these updates in mind, here's the top 100 counties ranked by per capita COVID-19 cases as of Saturday, October 31st (click image for high-res version). Blue = Hillary Clinton won by more than 6 points; Orange = Donald Trump won by more than 6 points; Yellow = Swing District
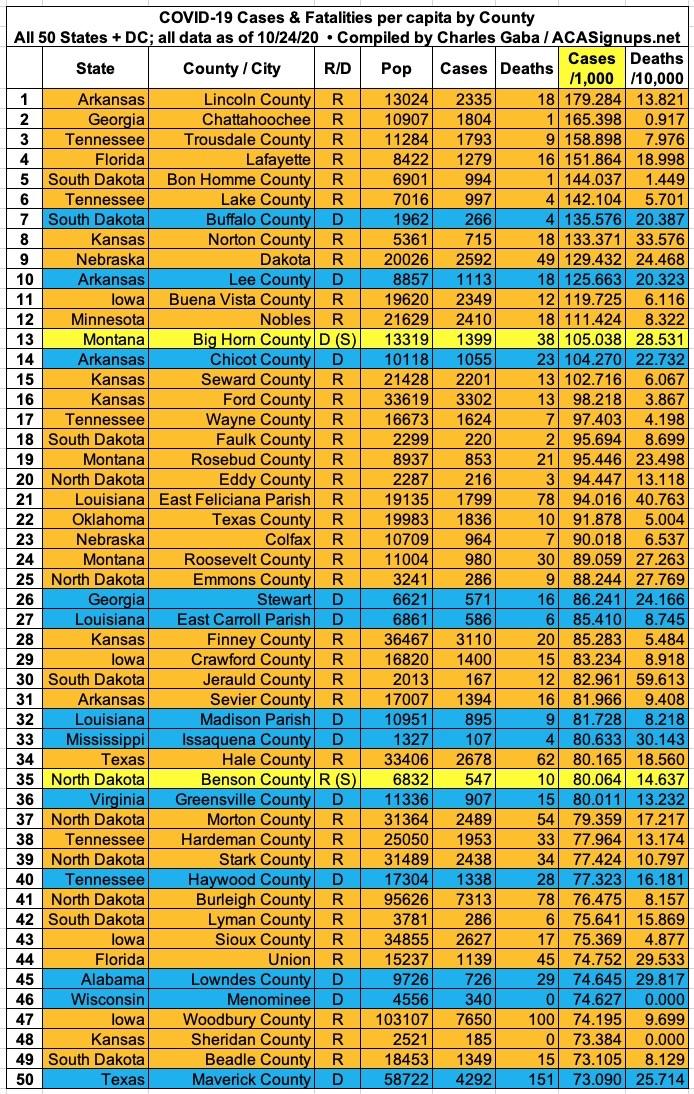
Lincoln County, Arkansas still holds the #1 spot. Over 2,300 of their 13,000 residents have now tested positive for #COVID19, or nearly 18% of the total population.
16 of the top 20 counties were solidly won by Donald Trump in 2016, as were 72 of the top 100.
Here's the top 100 counties ranked by per capita COVID-19 fatalities as of Saturday, October 31st (click image for high-res version):
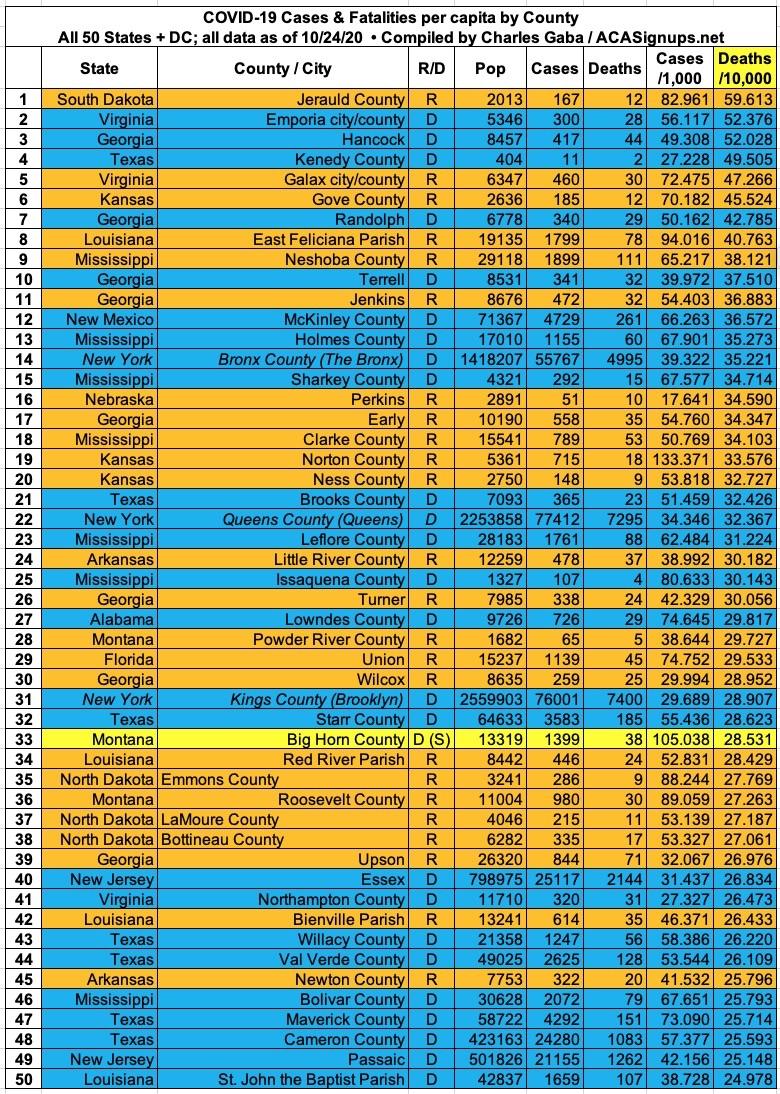

The #1 spot is now held Jerauld County, South Dakota, where 12 of the county's 2,000 residents have died of COVID-19, or nearly 0.6%.
11 of the top 20 counties were solidly won by Donald Trump, as were 58 of the top 100.
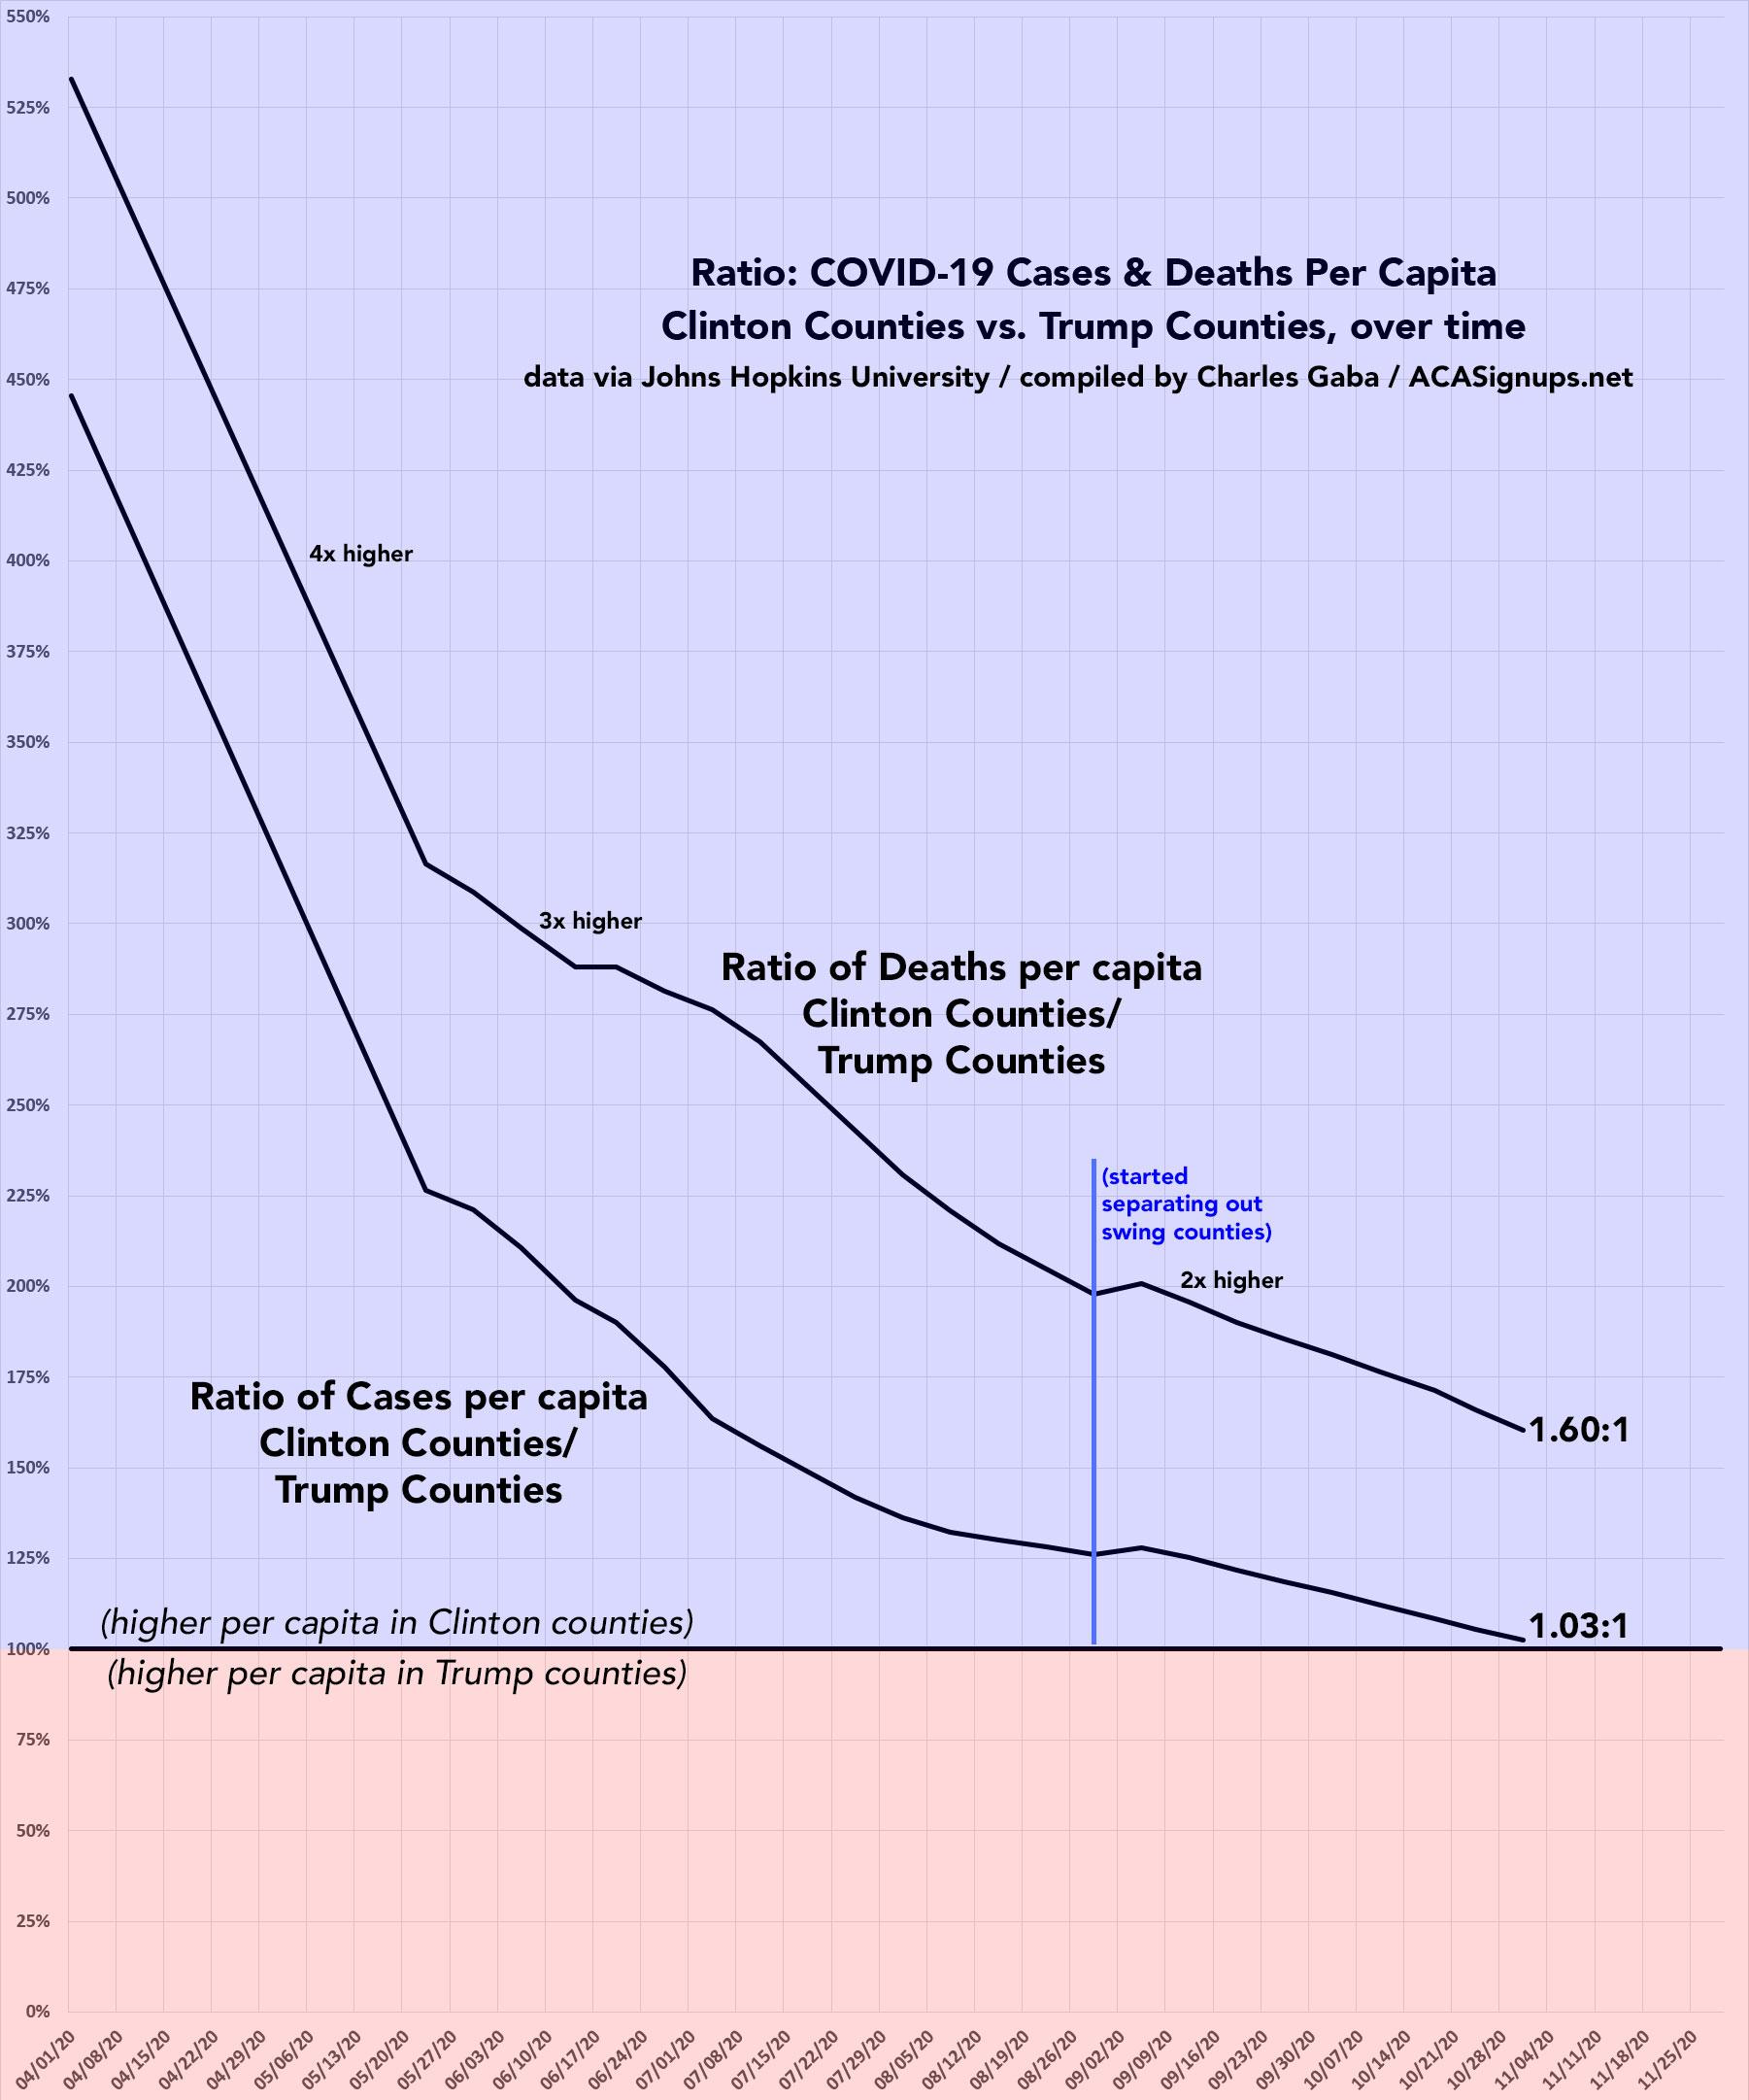
It's also worth noting how the ratio of per capita cases has shifted between the Clinton and Trump counties over time. Back in mid-March, the rate was 450% higher in Clinton-voting counties than Trump counties. As of this weekend that ratio was down to 3% higher. In terms of the mortality rate, the ratio has dropped from 530% to 160% higher.
As you can see below, separating out the ~200 swing counties from the Red and Blue ones caused the ratio between the two for both case rates and death rates to bump back up towards a higher blue county rate, but only slightly and only for that one week. The trend has continued downwards since then:
I've also taken a look at the counties with the lowest rates of COVID-19 cases and fatalities:
- There are 328 counties nationwide which have no COVID-19 deaths as of yet, down from 364 a week ago.
Total combined population of these 328 counties? 2.8 million people.
- There are only 5 counties nationwide which don't have any cases yet:
- Bristol Bay Borough, Alaska
- Juneau City & Borough, Alaska
- Kalawao County, Hawaiii
- Esmeralda County, Nevada
- Loving County, Texas
Total combined population of these 5 counties? 4,868 people.
Advertisement
