

Weekly Update: Which COUNTIES have the highest per capita rates of #COVID19 cases and fatalities?
Sun, 06/07/2020 - 12:33pm
Now that I've brought all 50 states (+DC & the U.S. territories) up to date, I'm going to be posting a weekly ranking of the 40 U.S. counties (or county equivalents) with the highest per capita official COVID-19 cases and fatalities.
Again, I've separates the states into two separate spreadsheets:
Most of the data comes from either the GitHub data repositories of either Johns Hopkins University or the New York Times. Some of the data comes directly from state health department websites.
Here's the top 40 counties ranked by per capita COVID-19 cases as of Saturday, June 6th:
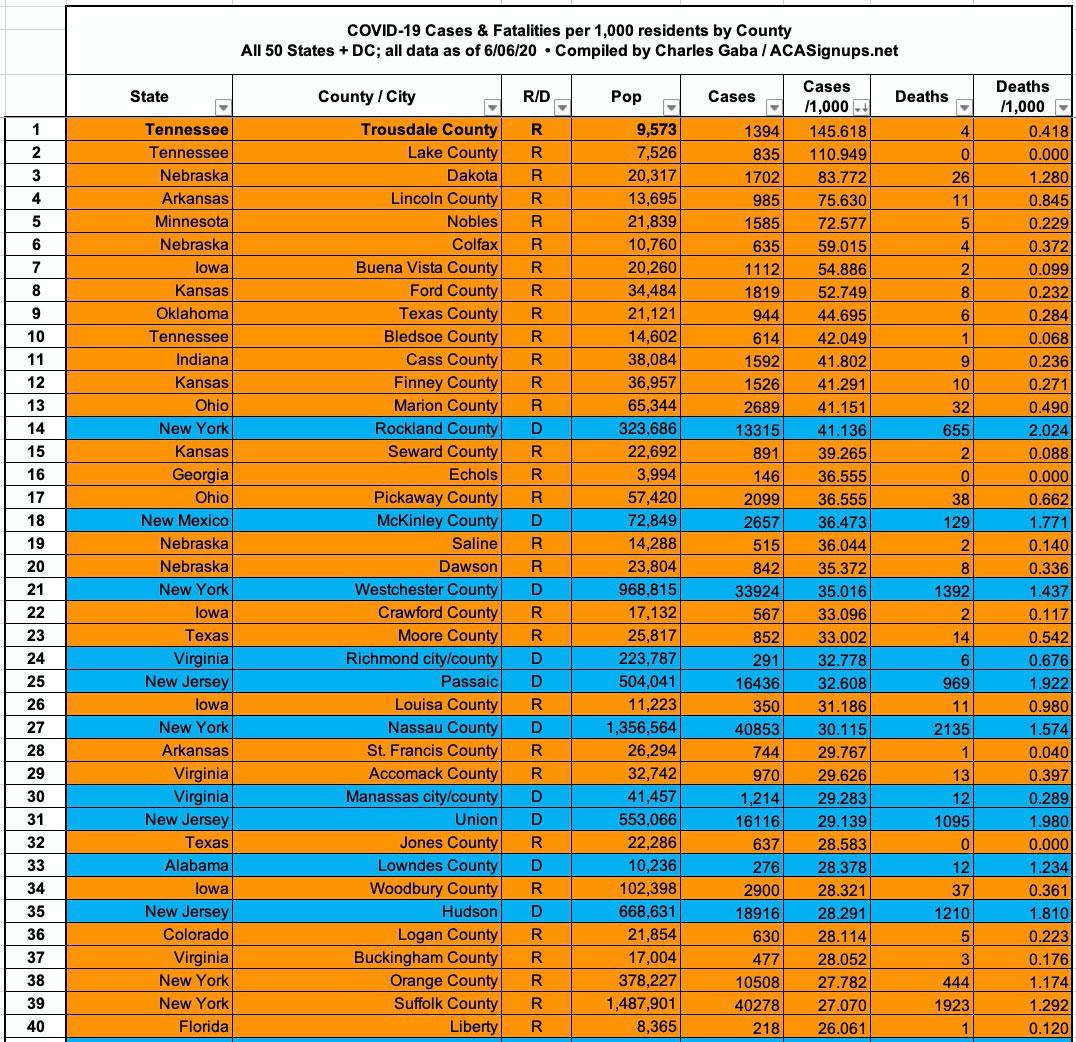
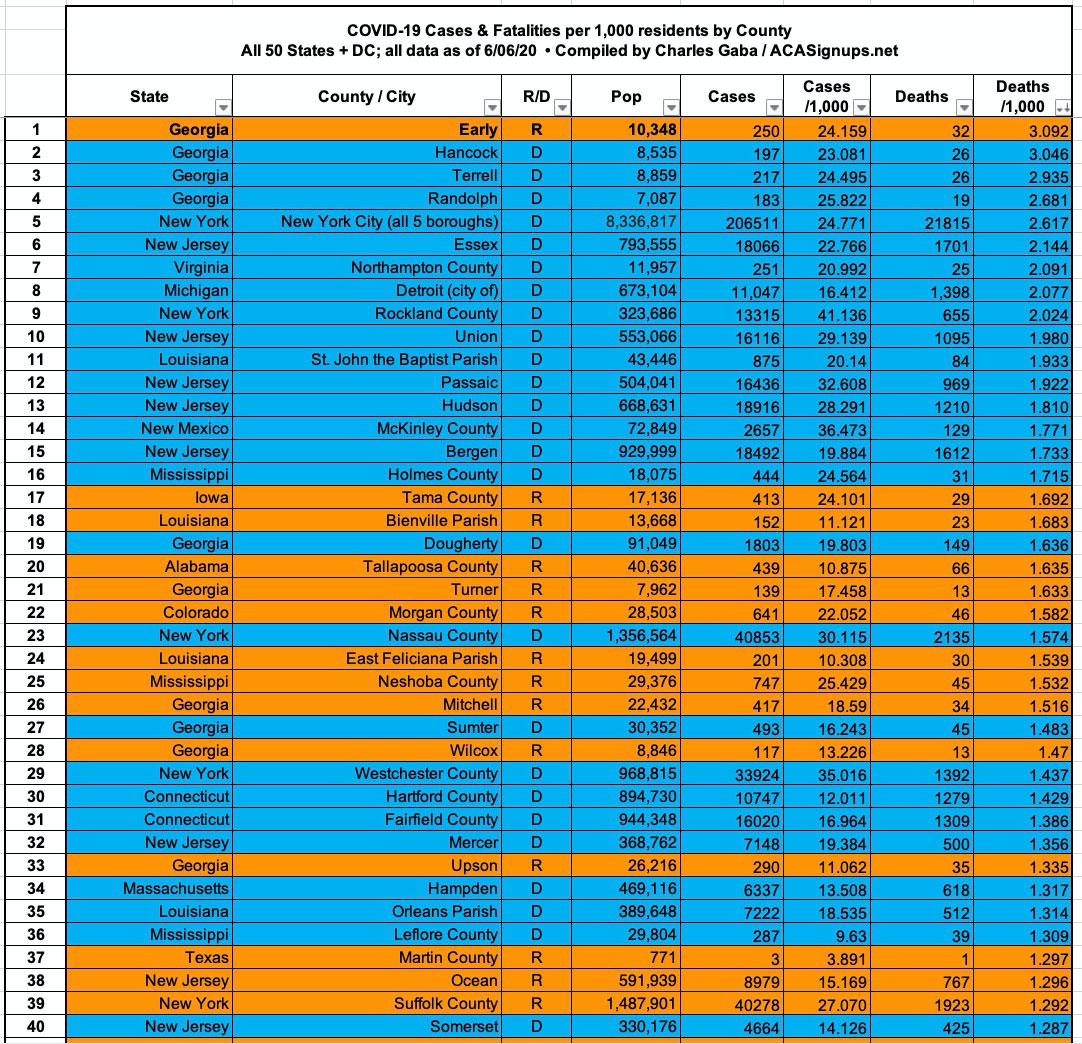
There's a clear disconnect between the counties with the highest rates of infection and the ones with the worst mortality rate. The 13 counties with the highest rate of infection are low-population rural counties which voted for Donald Trump, as are 20 of the top 25. On the other hand, 15 of the 16 counties with the highest COVID-19 mortality rates voted for Hillary Clinton, as are 17 of the top 25. It's actually more like 20 of the top 25, really, since both the NY Times and John Hopkins University data files lump all 5 New York City boroughs (which are actually counties) into a single listing. Four of the five are solid blue (the exception is Richmond County, aka Staten Island).
Setting political lean aside, while it's not exactly news that New York, New Jersey (and Detroit) hold multiple top spots, it's noteworthy that the four deadliest COVID counties are located in Georgia. In fact, 10 of the top 40 are Georgia counties regardless of red or blue status.
Here's the top 40 counties ranked by per capita COVID-19 fatalities as of Saturday, June 6th:
In terms of the political spin, it's also worth noting that while both positive cases and fatalities are still heavily concentrated in Democratic-leaning areas, both of those are gradually shifting towards GOP counties:
- As of 3/20, there were 4.5x as many cases per capita in Democratic counties and 5.3x as many fatalities per capita
- By 5/23, those ratios were dwon to 2.3x as many cases per capita and 3.2x as many fatalities per capita
- As of 6/06, the per capita ratios were down to 2.1x as many cases and 3.0x as many fatalities.
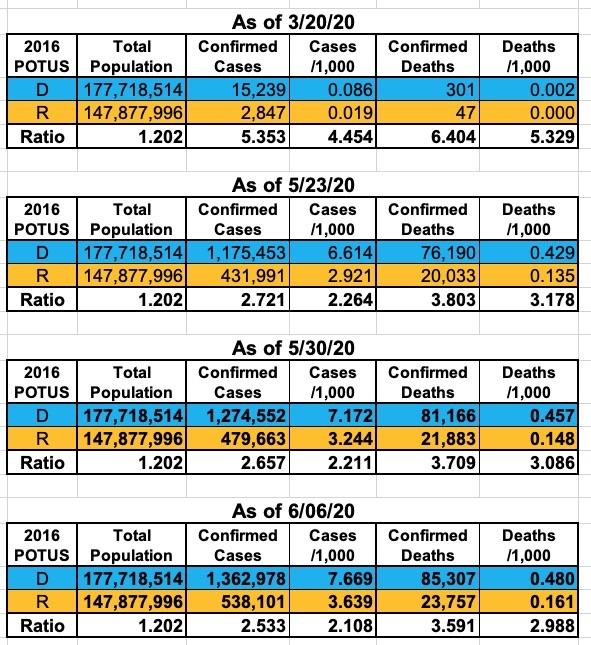
Assuming this trend continues, at some point (likely around Labor Day), there will be just as many cases per capita in red counties as in blue counties nationally, and blue counties will have only twice as high a rate of COVID-19 deaths. How this will impact the politics, policy and rhetoric in both Dem and GOP-run states will be impacted by how this trend plays out.
Advertisement
