

The Subsidy Cliff Reckoning Is Here: Six Years of the ENTIRE Indy Market in One Graph
Thu, 08/15/2019 - 11:07am
A couple of days ago, the Centers for Medicare & Medicaid (CMS) issued a press release which included a five-year effectuated enrollment report for the entire ACA-compliant individual market, both on and off exchange:
The Trends in Subsidized and Unsubsidized Enrollment Report
The report shows that people who do not qualify for APTC continue to be priced out of the market. Following a decline of 1.3 million unsubsidized people in 2017, another 1.2 million unsubsidized people left the market in 2018. These enrollment declines among unsubsidized enrollees coincided with increases in average monthly premiums of 21 percent in 2017 and 26 percent in 2018.
The decline began in 2016, as 23 states saw decreases from 2015 to 2016 among unsubsidized enrollees. Forty-three states saw decreases in unsubsidized enrollment from 2016 to 2017, and 47 states saw a decline from 2017 to 2018. During this most recent year, nine states including, Iowa, Georgia, Nebraska, Tennessee, Virginia, Kentucky, Missouri, Kansas and West Virginia, lost more than 40 percent of their unsubsidized enrollment.
While data from the Effectuated Enrollment report shows stability in Exchange enrollment and premium trends, affordability remains a significant challenge for people who do not qualify for Exchange subsidies. These reports place a spotlight on the millions of Americans priced out of the market by the high premiums that quickly emerged after the Affordable Care Act’s main regulations took effect in 2014. The Trump Administration remains firmly committed to helping those harmed and providing every American with more affordable healthcare options.
Most of the above paragraphs are true except for two parts:
- No, the decline didn't begin in 2016. 23 states had reductions in unsubsidized enrollees...but the other 26 saw increases (MA & VT aren't listed at all). TOTAL unsubsidized enrollment actually went up 4.2% in 2016, or by over 250,000 people.
- The last sentence is simply...misleading, to put it mildly. While the problem of affordability is very real for middle-income enrollees, a) a significant chunk of that problem was itself caused by Trump Administration policies; and b) the "more affordable healthcare options" they're pushing as a "solution" are anything but.
--
For years now, healthcare wonks across the country, including myself, have been urging Congress to fix various provisions of the Affordable Care Act. The single most important of these is the infamous Subsidy Cliff.
Once Again, in a nutshell, the Subsidy Cliff is this:
- If you enroll in an ACA-compliant individual market healthcare policy and earn between 100-400% of the Federal Poverty Level (around $12.5K - $50K for a single adult; around $25K - $100K for a family of four), you're eligible for financial assistance on a sliding scale.
- If you earn less than 138% FPL in a state which expanded Medicaid, you're supposed to be eligible for Medicaid.
- If you earn less than 100% FPL in a state which didn't expand Medicaid...well, you're kind of screwed (this is called the Medicaid Gap, but that's not the subject of this analysis).
- If you earn more than 400% FPL in any state, you're also kind of screwed...because you don't qualify for any financial assistance. It doesn't just taper off, it cuts off immediately the moment your MAGI income breaks 400% FPL by even one dollar.
For the first few years of the ACA exchanges, this wasn't too much of a problem, as the full-price premiums weren't too bad. Average premiums increased each year, but the pre-ACA average premiums which those increases were based on were pretty low (since carriers were allowed to cherry pick enrollees and deny coverage to anyone who was "too expensive" to treat), so it was tolerable for middle-class enrollees earning between 400% and, say, 800% FPL. People grumbled, of course, but for the most part the unsubsidized market (which is mostly off-exchange) grew, from 3.7 million in 2014 to over 6 million in 2015 before peaking at 6.3 million in 2016.
Starting in 2017, however, premiums increased sharply (by nearly 25% on average), mainly due to the ACA's federal reinsurance program, which helped restrain rate hikes, sunsetting. This, combined with sabotage and confusion caused by the Trump Administration and Congressional Republicans throughout the year, resulted in total on-exchange enrollment dropping by over 465,000 people during the 2017 Open Enrollment Period...and total ACA-compliant enrollment dropped by nearly 1.5 million by the time the year ended. Of that, 86% were unsubsidized enrollees (and 84% of whom had previously been on the off-exchange market, where no one is eligible for financial assistance).
Subsidized enrollment, meanwhile, only dropped slightly (around 2.5%)...as did on-exchange unsubsidized enrollment, which also only dropped by 2.3%...an even smaller percentage than subsidized. Huh. Unsubsidized enrollees who go on-exchange are generally people who have highly variable incomes (presumably self-employed)...they never know from year to year whether they're going to earn 300% or 500% FPL, but since ACA subsidies are only available on-exchange, they sign up there just in case. My own family falls into this category.
In 2018, full-price premiums spiked even more dramatically, by around 27% on average. While the reasons for the 2017 hikes were a mixed bag, this time the primary blame fell squarely on the Trump Administration's decision to cut off Cost Sharing Reimbursement payments. This set off a chain reaction of responses by the insurance carriers and state regulators, but the bottom line is that a good 3/5ths of the 2018 premium increases was due specifically to Trump Admin actions.
As a result, on-exchange enrollment dropped another 466,000 people during Open Enrollment...and total monthly average unsubsidized enrollment (both on & off-exchange) dropped by another 1.2 million people. At the same time, this was partly offset by a 4.2% increase (nearly 350,000) in subsidized enrollees, for a final net loss of almost 890,000 people from the overall ACA market.
Between 2017 and 2018, a total of just over 2.5 million unsubsidized enrollees have fled the ACA-compliant individual health insurance market...while subsidized enrollment has grown by a net of 143,000 people.
The reason for this is pretty obvious. There have been some measures taken to mitigate the problem: Silver loading and silver switching is being widely used to offer some relief to off-exchange enrollees, and some states have instituted their own state-level reinsurance waiver programs to cut full-price premiums down to size...but the bottom line is that even with these programs, unsubsidized premiums are simply too high for too many people.
The Trump Administration's "solution" to this problem has been to open the floodgates on non-ACA compliant "healthcare plans" ranging from pushing for bare-bones "Short-Term, Limited Duration" plans (by making them no longer short-term or of limited duration); "Association Health Plans" (which have a long, ugly history of fraud and abuse); "Sharing Ministries" (some of which are legitimate, but which are still open to massive misrepresentation and fraud problems), and so forth.
These types of offerings, many of which are accurately described as "junk plans", have exactly the types of problems the ACA was trying to reduce or eliminate in the first place. EXPANDING them is not the answer.
The ACTUAL solution to this--assuming you're not talking about a complete overhaul of the entire system--is obvious: KILL THE SUBSIDY CLIFF.
Removing the 400% FPL cap on financial assistance and instead limiting premiums to no more than 9.8% (or better yet, 8.5% as laid out in H.R. 1868) regardless of income would instantly eliminate nearly all of the "demand" for any of these non-ACA compliant policies in the first place. Millions of middle-class Americans would suddenly see Affordable Care Act policies become...Affordable again. This doesn't just include the 2.5 million who have left the market over the past two years...it also includes millions who never bothered signing up in the first place due to their ineligibility. My guess is that passing this one bill into law would single-handedly increase ACA exchange enrollment by a good 7-8 million people or more:
- The 2.5 million who've dropped out since 2016,
- The 2-3 million unsubsidized who've stuck it out this long, and
- At least a few million other uninsured folks who were never part of the market to begin with.
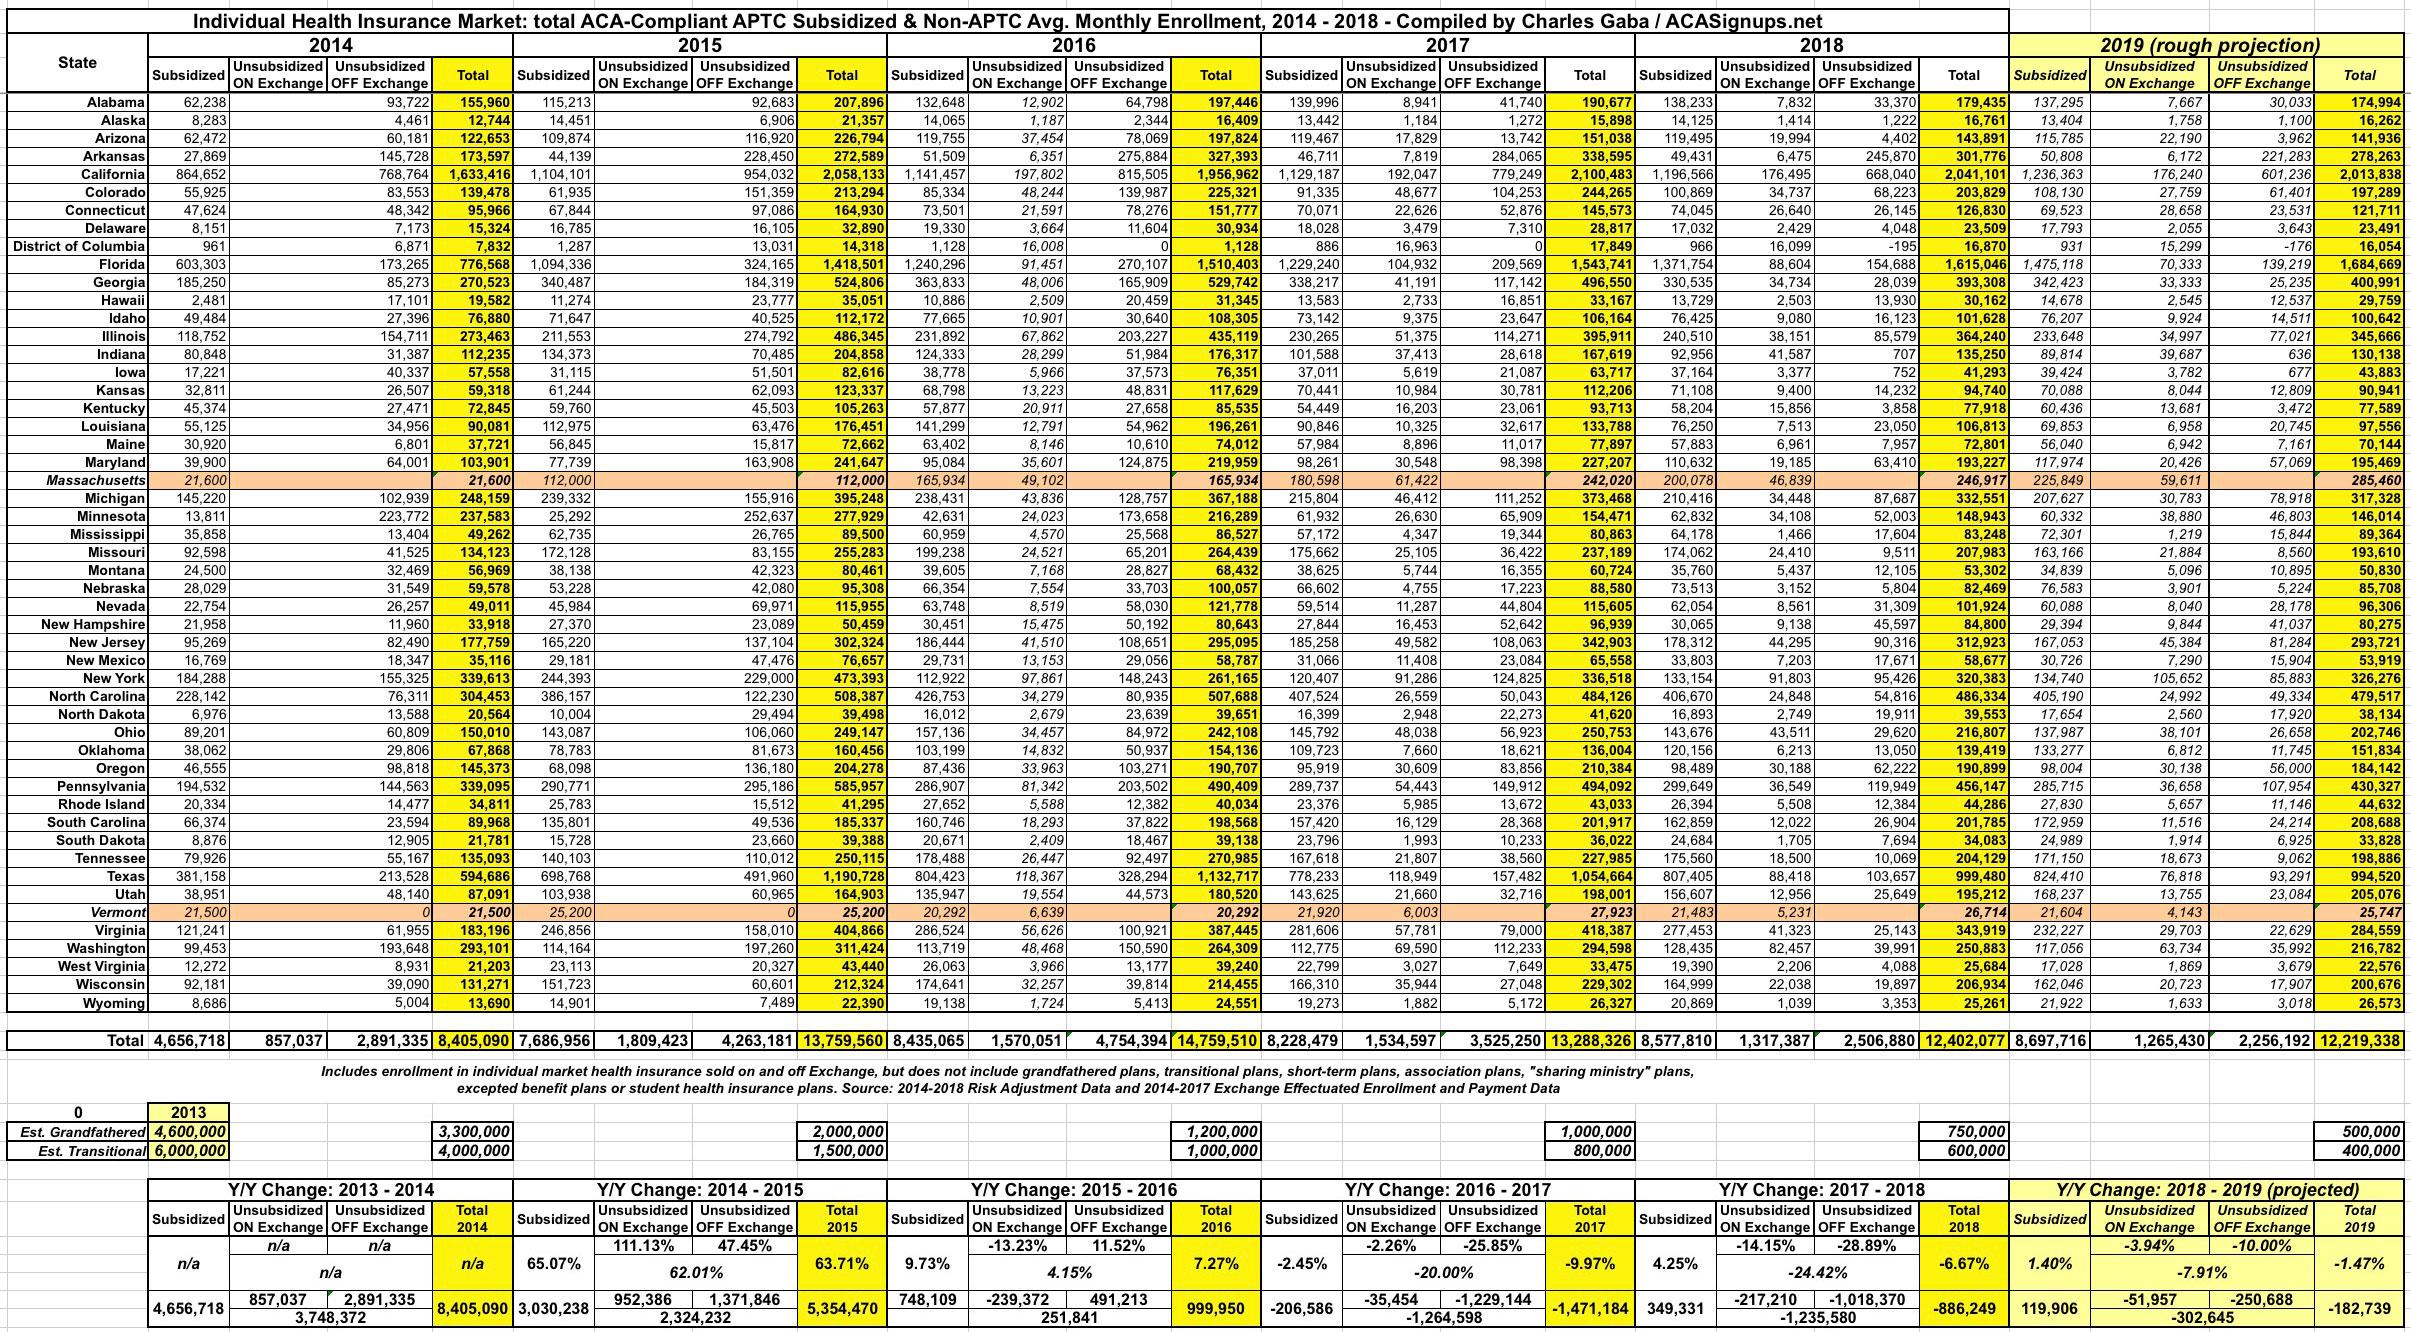
In any event, the table below breaks out the total average monthly ACA-compliant individual market enrollment in every state from 2014 - 2018...and even includes estimated projections for 2019. Each year has been further broken out between subsidized, on-exchange unsubsidized and off-exchange unsubsidized enrollees.
Most of the data below comes from CMS's Trends in Subsidized and Unsubsidized Enrollment report. The breakout between on & off-exchange subsidized enrollment comes from previous CMS reports and Public Use Files. CMS chose not to include data for either Massachusetts or Vermont because these states have merged their individual and small group market risk pools. I understand why they did so, but it still makes more sense to me to include them in order to present a fuller picture, so I've plugged in effectuated enrollment data for MA & VT whereever possible. There's still some blank fields, but these two states combined represent only about 2% of the total ACA market, so any impact from including them should be nominal. Unfortunately, while I have the breakout for on-vs-off exchange enrollments nationally, I'm still missing the state-level data from 2014 & 2015.
For 2019, based on the initial effectuation data as of February, it's looking very much like the on-exchange enrollment situation has pretty much stabilized. Effectuated enrollment as of February 2019 is only down 0.6% vs. February 2018, with subsidized enrollment up 0.2% while unsubsidized on-exchange enrollment is down 6.0%. Projected across the rest of 2019, I'm assuming subsidized enrollment will, on average, be up about 1.4% while unsubsidized on-exchange enrollment will drop by around 4.0%. For off-exchange enrollment, I have no way of knowing, but I'm guessing that the dramatic 26% and 29% drops from 2017 and 2018 will taper off to perhaps a 10% drop for the year since average premiums went up less than 3% in 2019 (and are set to be nearly flat in 2020).
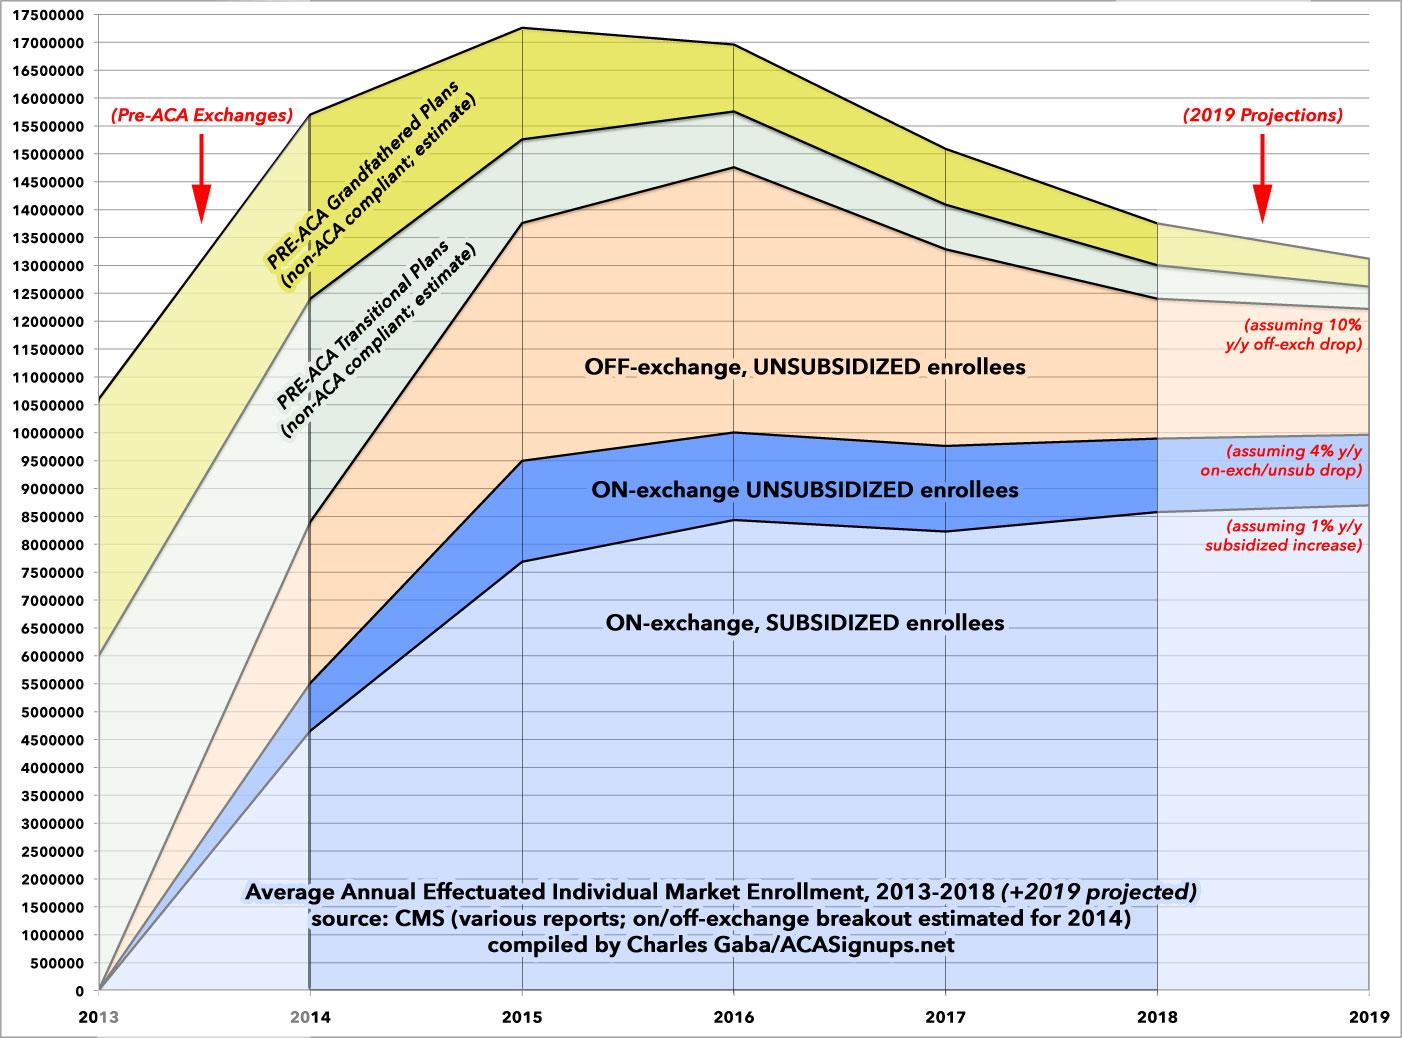
With all this in mind, I present Six Years of ACA Individual Market Enrollment in a single (massive...click on it for a high-res version) table...followed by a graph version, which also includes my best estimates of the "Grandfathered" and "Transitional" market enrollment left over from before the ACA plans went into effect in 2014. The Grandfathered/Transitional lines are roughly based on estimates by the Kaiser Family Foundation, as well as my own educated guesses for 2018 & 2019.
Advertisement
