

How the ACA *ALMOST* Got its Groove Back.
Fri, 06/29/2018 - 10:09am
A couple of days ago, the nonpartisan Kaiser Family Foundation posted an important new analysis (actually a follow-up version of an earlier one they did in May) which proved, in several different ways, that after years of turmoil, the ACA's individual market had finally stabilized as of 2017...or, at least, it would have if not for the deliberate sabotage efforts of one Donald J. Trump and several hundred Congressional Republicans. This included hard numbers for the first quarter of 2018 which showed the trend continuing in a dramatic fashion.
Following up on that, they went further yesterday and posted a whole bunch of handy raw individual market data for the 2011 - 2017 calendar years at the state level, including the average gross profit margin per member per month as well as the share of premiums paid out as claims in every state (except, frustratingly, California).
I decided to take the second data set and flip it around: Instead of graphing what percent of premium dollars have been paid out in medical claims, I'm graphing the gross profit margin...that is, the part which isn't paid out in claims. This is the portion left after the insurance carriers pay off the doctors, hospitals, drug companies, medical device makers and so forth.
This is also what they use to pay for administration, overhead, marketing and so on, although it's important to remember that this is only for the individual market division of their business; employer-based coverage, managed Medicaid and Medicare Advantage make up a much larger portion of most carriers' income, so even if they lose money on the indy market, most still make a profit elsewhere.
Before you read the graph, it's vitally important to understand that the Affordable Care Act requires carriers to spend at least 80% of individual market premium dollars on actual medical care. In other words, if they bring in $100 million in premiums in the individual market, at least $80 million of it has to be spent on actual healthcare claims, leaving only $20 million for administration, marketing etc. If they end up falling below that threshold--that is, if they only spend $75 million in claims--they don't get to keep the other $5 million; it has to be rebated to their policyholders. This is known as the "Medical Loss Ratio" rule, or MLR for short.
If a carrier end up spending more than 80% on claims...well, they have to either eat the loss and try to price more successfully the following year. It's very tricky to hit the mark, which is why insurance companies employ a bunch of actuaries to try and figure it all out. Making it even trickier is the fact that the MLR rule is based on a three year rolling average. This helps smooth out the rough edges, so if a carrier has one great year followed by two crappy years, they aren't penalized for the first while left high & dry for the other two. Only 1/3 of each year's MLR is utilized per year and combined with the other two.
The ACA was signed into law in 2010, but the major provisions which really disrupted the market and completely changed the rules didn't go into effect until 2014. As a result, from 2011-2013 (before stuff like Guaranteed Issue, Community Rating and so on went into effect), the market was fairly stable--the MLR rule was in effect, and hundreds of millions of dollars was quietly rebated to millions of people...perhaps a bit TOO quietly (this was as of 2014):
An obscure Obamacare feature may net health insurance customers $332 million this year.
That's the total insurance companies will have to give back to customers this year under an Affordable Care Act provision designed to keep companies from overcharging consumers, the Department of Health and Human Services announced on Thursday. Including this year, consumers will have recovered a total of $1.9 billion from insurance companies since the rule took effect in 2011, according to the department.
Under President Barack Obama's signature health care reform law, insurance companies must spend at least 80 percent of the premiums they collect on actual medical care, rather than on overhead and profit. They are required to give rebates to consumers, or to their employers in the case of job-based insurance, if they fail to meet that standard. Close to 7 million people are due refunds by Aug. 1, with an average of $80, according to a report issued by the department.
OK, $80 isn't much, but still, a buck's a buck. The point is to try and keep insurance companies from price gouging by jacking up rates however high they want and then spending premium dollars on marble staircases or CEO junkets to Tahiti or whatever. State insurance commissioners are also supposed to help keep premium rates in check as well, but the MLR rule acts as an extra safety catch, and clearly it works pretty well since a couple billion dollars was refunded before the major ACA provisions even kicked into effect.
It's also important to note, as David Anderson did this morning over at Balloon Juice, that the MLR data used below is raw, and is not quite the same as the data used by the Centers for Medicare & Medicaid (CMS) to calculate MLR thresholds and rebates; there's some other factors which are added into the equation. Anderson says that the actual MLR "tends to be a point or two higher in general than raw MLR", so I've nudged the threshold line down from 20% to 18% to illustrate that there's some wiggle room at play. Again, this is mostly just for illustrative purposes.
I had originally hoped to cram in all 51 states (including DC), but obviously that would be far too unwieldy, so the chart only includes 15 of them, as well as the national average (in black). Click on the chart for a high-res version:
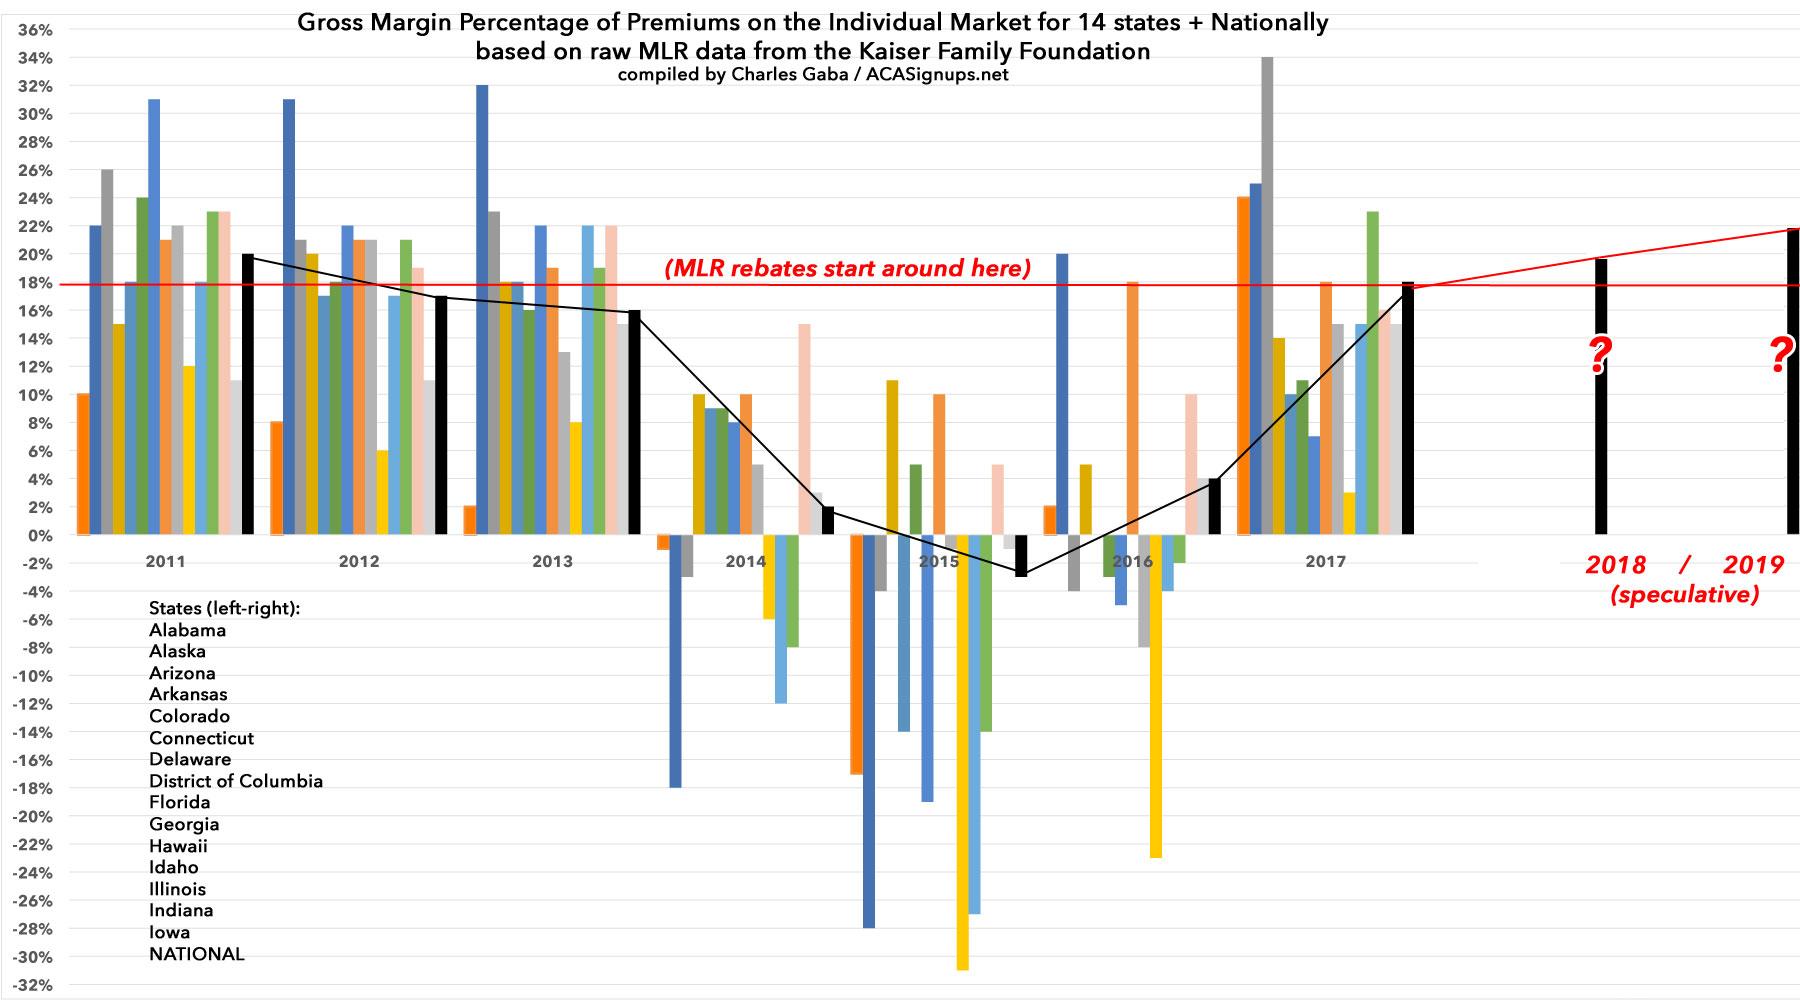
As you can see, from 2011-2013, carriers in most states were hovering somewhere around 18% (nationally, it was 20%, 17% and 16% respectively). This makes sense, as it took a year or two for the carriers to keep below the threshold target. States like Delaware and Alaska were way above where they should have been...and in turn, they had to rebate a significant chunk of change, while carriers in states like Alabama and Hawaii were already operating on very thin margins in the individual market to begin with.
Then came 2014...and the individual market was largely thrown into chaos. All of the pre-2014 actuarial playbooks had to be thrown out. Adding Guaranteed Issue and Community Rating, along with other assorted ACA regulations, meant that carriers could no longer cherry-pick enrollees based on their medical histories (or discriminate on pricing because of it). No one knew exactly how this would impact claims costs, since there was no way of knowing how many people who had been left out in the cold before would jump into the market, or how expensive their medical problems would be. Everyone knew that adding them to the mix would increase costs, but no one knew how much costs would increase.
Well, it turned out the answer was "quite a bit"...and more to the point, "quite a bit more than most carriers thought". There were, in short, a lot more people with really expensive medical problems who didn't have anywhere to go until 2014 who flooded the market. At the same time, the hoped-for influx of young, healthy enrollees (who would partly balance those expensive folks out) ended up falling short of expectations.
Because everyone involved knew there would be a lot of uncertainty at first, there were three stabilization programs put into place: Reinsurance, Risk Corridors and Risk Adjustment. The first two were supposed to be temporary (3 years only) to tide things over and smooth things out during the first few rocky years; the third was put in place permanently. The risk adjustment program, to my knowledge, works pretty well although I understand it needs some formula tweaks (I admit that of the three, this is the one I understand the least). The reinsurance program also worked pretty well, I believe...but unfortunately was sunsetted after 2016.
And then there was the Risk Corridor program, which also only lasted three years but didn't even make it that far due to the infamous #RiskCorridorMassacre, which resulted in it effectively being cut off at the knees in the first year and being defunct for the other two. The RC program ended up not only being ineffective, but due to how it was implemented and messed with ended up making things worse for a bunch of carriers, and some of them (moslty a dozen or more Co-Ops set up by the ACA) even went out of business in large part due to this.
There were other unexpected twists and turns as well. The Supreme Court ruled in 2012 that Medicaid expansion couldn't be made mandatory for every state; it had to be voluntary, so half the states didn't bother to do so (although a bunch more have come around since then). The launch of HealthCare.Gov, as well as some of the state-based exchange websites, had some horrific technical problems which discouraged people, caused confusion and took weeks or months to fix. In response to the "You Can Keep It!" backlash, President Obama and the HHS Dept. allowed states to let several million people enrolled in pre-ACA policies, which were supposed to be phased out at the end of 2013, stay on them for another year (which eventually turned into two years...then three...) Meanwhile, Republicans at both the federal and state level were doing everything in their power to obstruct, undermine and otherwise mess with the law being implemented. Finally, some carriers like Aetna played games like pulling out of ACA markets they were profitable in in what appeared to be a deliberate attempt to make themselves look worse off than they were...just to get approval of a corporate merger.
Combine all of that with the carriers effectively throwing darts blindfolded in the first place and as you can see, most carriers missed the dartboard entirely. MLRs of 90-95% were common in 2014 - 2015, and some carriers were even losing money on the individual market outright before taking into account administrative costs, etc.
Some carriers went belly up (again, a chunk of this was due to the Risk Corridor Massacre, but there were other reasons as well). Some panicked and bailed on the market altogether, while others significantly pulled back on their coverage areas and/or how many plans they offered to limit their downside exposure to risk. Pretty much all of those who stuck around raised rates significantly to try and account for the influx of older, sicker folks.
Things started to turn around in 2016 as more carriers righted their pricing and product placement ships. Yes, more carriers bailed or shrank their offerings, but others started to break even or even make a buck or two on the ACA market. On the whole, the carriers pricing had finally reached equilibrium with the claims cost...as shown in the chart, the national average raw gross margin had hit around 4%. That was enough to cancel out the claims, but not enough to cover administrative overhead.
2017 pricing...which was actually locked in just before the 2016 election...was where the rest of the band-aid was ripped off: Average premiums were raised around 20-25%. As a result, while some states were still coming in low (or high, depending on your POV), for the most part they were right back up to where they should have been: Around an 82% raw MLR, or 18% gross margins, just like before 2014.
IF that was where the story ended, then the chart for 2018, 2019 and beyond would probably have gone back to being pretty dull: Premiums would still have gone up 5-10% per year due to underlying medical trend and other sundry factors, but that would be about it. Don't get me wrong: I'm not saying that would have been awesome. After all, 5-10% per year is still more than twice the rate of general inflation, and the 4 years of increases in between had already made premiums (and deductibles) way too expensive for millions of unsubsidized enrollees. There still would have had to be major changes/improvements made, like raising/removing the 400% FPL subsidy cap, cracking down on drug companies and so on. Clinton would have slugged it out with a GOP-controlled Congress. Little would have changed for better or worse.
However, at least the major bleeding would have been stopped.
INSTEAD...Donald Trump became President, the GOP retained control of Congress, repeal/replace efforts went into overdrive, Trump repeatedly threatened to "blow up" the ACA and did his damndest to do so by signing executive orders instructing the federal executive branch to obstruct/undermine it as much as possible, told the IRS not to enforce the individual mandate penalty, had his CMS Dept. slashed the 2018 enrollment period in half, slashed marketing and outreach budgets by 90% and 40% respectively...all of which culminated in Trump cutting off Cost Sharing Reduction (CSR) reimbursement payments to the carriers, which cut a couple billion dollars out of their 2017 revenue and threatened to hack it down by another $10 billion or so this year.
In response to each of these moves, the carriers nudged their 2018 premium pricing up...and up...and up again, to cover either their risk or, in the case of the CSR cut off, their actual, known losses. To the best of my calculations, the ~29% average increase in unsubsidized premiums this year broke out roughly as follows:
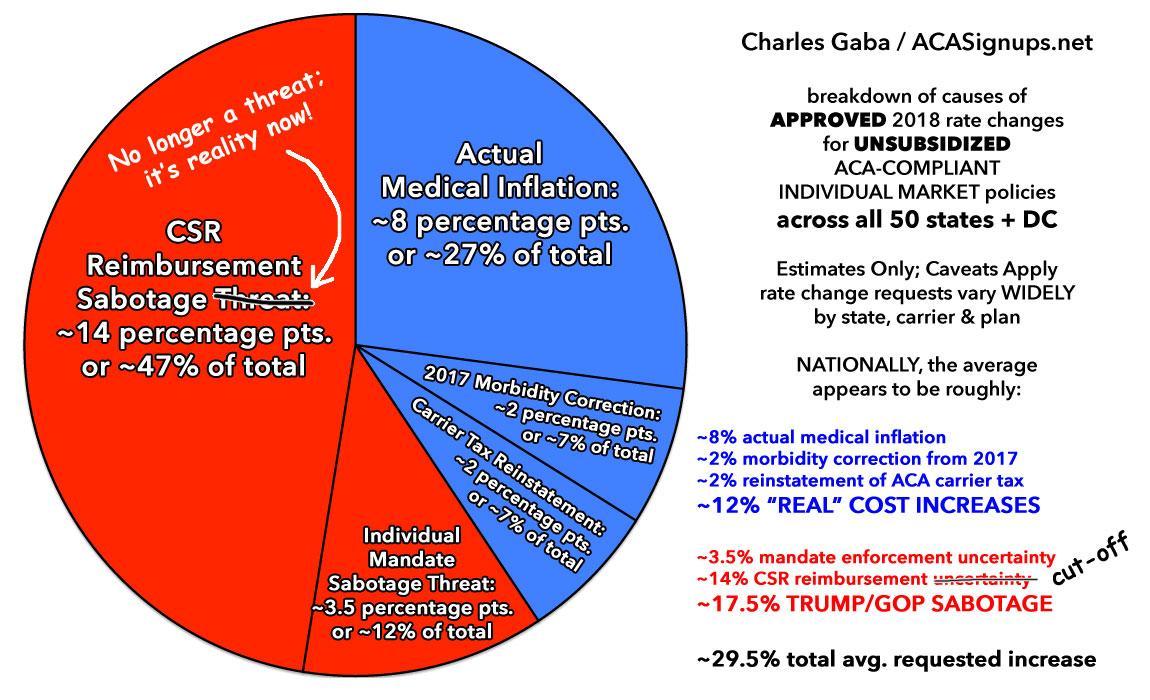
The simple version is that roughly 17-18 points of that 29% total was due specifically to the factors listed above, with the other 11 points or so being "normal" factors, including a final bit of lagging corrections from prior years. Take away all of those and the reinstatement of the ACA Carrier Tax (which had been charged in 2014-2015, wasn't charged in 2016-2017 and was charged again in 2018), and I believe the 2018 medical trend was more like 8%.
So what about 2019? Well, practically every expert, from the Congressional Budget Office to the Urban Institute to the HHS Dept's own Chief Actuary agree that this year's sabotage efforts by Trump and Congressional Republicans (primarily repeal of the individual mandate and expansion of minimally-regulated Short-Term and Association plans) will add something like 10-20% to next year's premiums due to the impact of adverse selection. Specifically, more healthy people will drop out of the ACA market and chase after dirt-cheap junk policies, hurting the ACA risk pool further.
But here's where things get really tricky: As I've been noting for several weeks, and as Larry Levitt of Kaiser confirmed yesterday, it's starting to look like many/most of the carriers overshot the mark last fall for this year. Basically, they raised rates an average of perhaps 10 points more than they probably needed to, give or take. That pie chart above should have been about 1/3 smaller than it is, though I don't know which factors turned out to be less of a problem than estimated. Probably some of each.
And that's what Levitt's Tweet from the other day is referring to:
In the early years of the ACA, insurers set premiums too low to cover medical claims and administrative costs. Now premiums may be too high. This means a complicated story for 2019: Repeal of the mandate penalty will push premiums up, but excess profits could push them down.
This is precisely what I've been finding with my state-by-state analysis of 2019 rate changes so far: Instead of average increases of 20% or so, so far it's been more like ~11%...because a lot of carriers are subtracting 5-10 points to ensure they're in line with the ACA's 80/20 MLR rule regardless of other factors.
Now, that's a good thing, and it means that many states will probably end up coming in with lower rate increases than expected (or even small decreases in some cases)...but it's really, really important to understand that the ~10-12 point sabotage factor is still included in those rates as well.
In other words, instead of this:
- +8% (medical trend) + 12% (sabotage) = +20% total increase
...it's looking more like this:
- +8% (medical trend) + 12% (sabotage) - 9% (excess profits) = +11% total increase
...except that if you remove that 12% (sabotage) factor, it would look more like this:
- +8% (medical trend) - 9% (excess profits) = -1% total decrease
Again, this is a crude example, buty you get my point. In fact, there's even cases like Minnesota, where the rates will go down next year...but would have gone down even more without the sabotage factors.
These numbers will bounce around some more throughout the summer and fall as more states release their 2019 rate filings, and as those filings are reviewed, modified and finalized...but the overall story is pretty clear: Again, Levitt said it best:
If not for looming repeal of the mandate penalty and expansion of loosely-regulated plans, we'd be looking at modest premium increases and even decreases for 2019.
Advertisement
