

2018 RATE HIKES: WHERE THINGS STAND.
Wed, 09/06/2017 - 5:29pm
Up at the top of the site is a big yellow button leading directly to the ongoing 2018 Rate Hike project. Let's face it, though: It's an awful lot of updates to scroll through. In addition, now that we're past the (extended) rate filing deadline, I've been able to make a lot of updates over the past few days (shoutout to Louise Norris, who did much of the grunt work on these).
As of today (September 6th), I now have average requested 2018 rate changes for the individual market across all 50 states + DC, and have made updates/corrections to several of these.
More importantly, I also now have approved 2018 rate changes for 6 states. They only represent around 9% of the population, though, so I wouldn't focus very much on the "national average" for the approved states yet; that will jump around a lot as more states are added to the mix, and likely won't start to settle in until at least half the states are included.
Having said that, here's what things look like as of today:
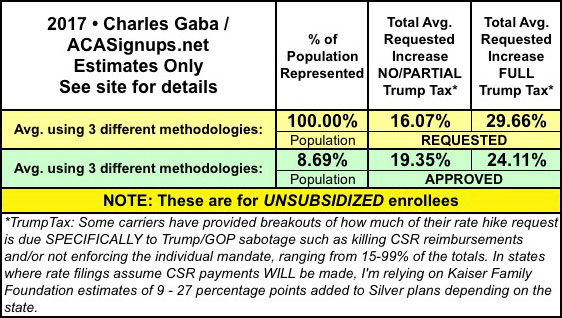
Here's an updated/revised version of the national breakout of the requested rate increase overview (again, I'll do this for the approved averages once I have at least half the states baked in). Things haven't changed that much since mid-August, when I only had 46 states included, but there are some small differences:
- In August, I estimated CSR sabotage at just over half of the 29% total average increase; I've lowered this slightly to 47% of the total (which has inched up to 30%). Remember, for purposes of this analysis, I'm assuming CSR losses will be spread across all ACA-compliant policies (all metal levels), although in most states it'll likely be loaded into Silver plans exclusively.
- In August, I estimated total Trump/GOP sabotage at around 2/3 of the total average increase; I've lowered this to around 60%.
- In August, I had the non-sabotage factors broken into just 2 parts: Medical inflation and the reinstatement of the ACA carrier tax. After reading over more filings and thinking it through, I've decided that it's a bit more complicated than that; many carriers have stated that their "morbidity" in 2017 is still a bit worse than they thought, which basically means that a couple of rate hike points are still simply making up for underpricing in previous years.
With these updates, here's what it looks like now: Trump/GOP sabotage is still responsible for a good 60% of the requested rate increases (~18 points), while "legitimate" price increases make up the other 40% (~12 points).
Put another way: If Hillary Clinton was President today, the average rate increases being asked for would be roughly 12% instead of 30%. Don't get me wrong, a 12% increase still wouldn't be anything to brag about given the increases over the past 2 years, but it'd still be a whole lot better than 30%.
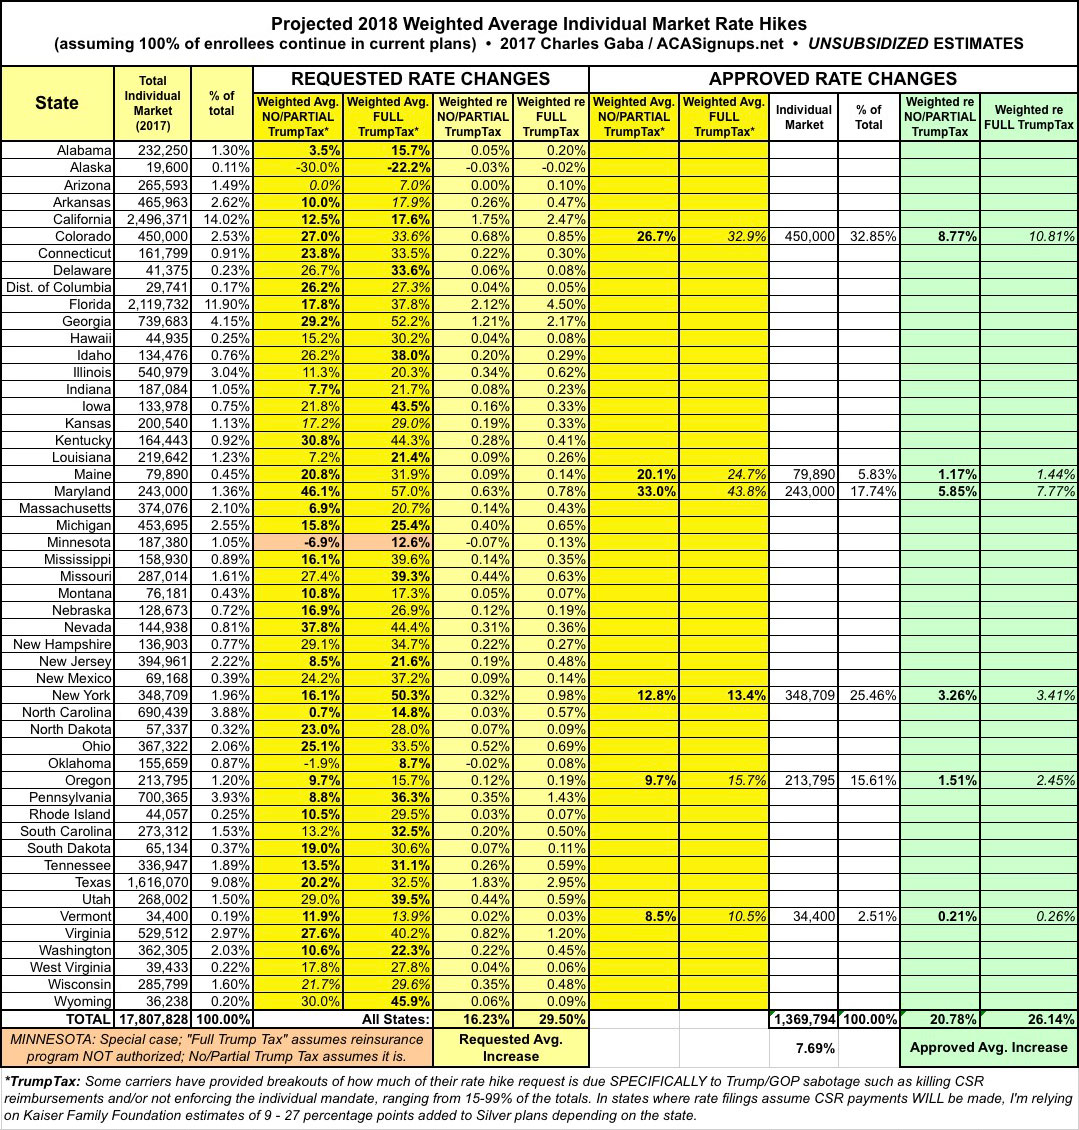
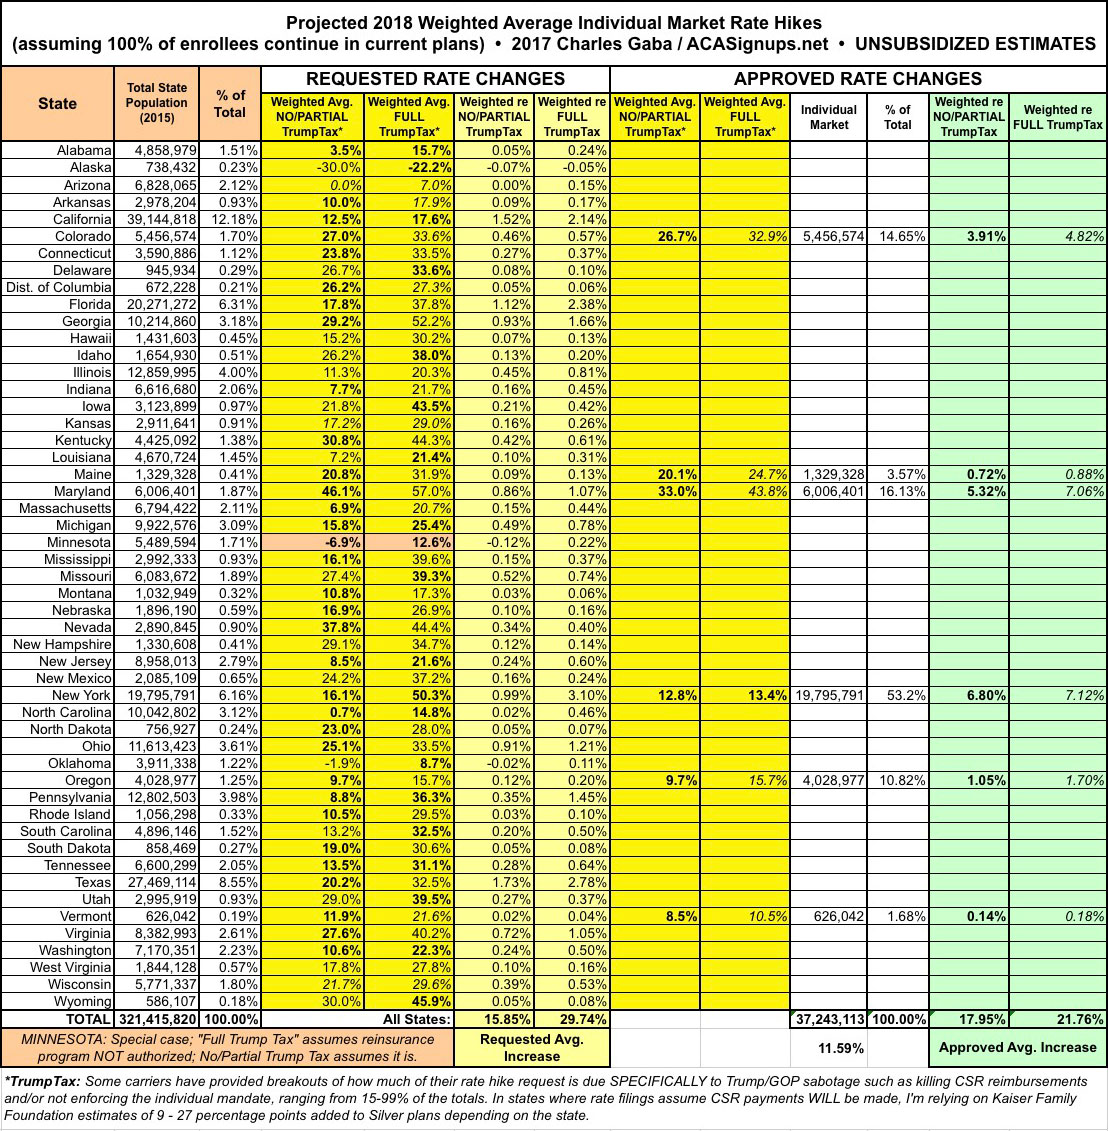
Below the pie chart are the state-by-state breakouts, including all four average rate changes for each state (requested with/without CSRs; approved with/without CSRs). I'll post the next full analysis of the rate hike situation after I've locked in approved increases for states representing at least half the population.
(click images for high-res versions)


Advertisement
