

Steve Davis & Robert Laszewski confirm what I've been saying all along: Appx. 40% of ACA indy market is OFF EXCHANGE.
Tue, 09/06/2016 - 1:54pm
For 2 1/2 years, dating back to around February 2014, I've been trying to hammer home the importance of the OFF-exchange individual market. Time and time again I've been stunned at the seeming blind spot that people who should know better (such as Avik Roy) have regarding the millions of people who are enrolled in fully ACA-compliant policies, but are doing so directly through the carriers themselves. There are a few reasons why people buying individual/family policies would do this, but the most obvious one is simple: If you earn more than 400% of the Federal Poverty Level (around 97,000/year for a family of 4), there's no reason to jump through the extra hoops of enrolling through HealthCare.Gov or the other various ACA exchanges...because you don't qualify for federal financial assistance anyway. For whatever reason, however, numerous reporters, pundits and even the HHS Dept. itself keep acting as though this market doesn't exist.
How many people are we talking about here? Well, back in 2014 I estimated that roughly 8 million people had signed up as of mid-April...almost exactly the same as the 8.02 million who selected QHPs on the ACA exchanges, or about 50% of the total. That 8 million included several million transitional and grandfathered policy enrollees, however, though I wasn't sure what the breakout was.
By this year, the exchange-based number had grown to around 11.1 million as of March 2016, of course...but the off-exchange number has been tougher to estimate. I've generally estimated the total off-exchange indy market at around 8-9 million, with roughly 7-8 million of that consisting of people enrolling in ACA-compliant plans at full price, and another 1-2 million or so enrolled in ACA-noncompliant "grandfathered" or "transitional" policies:
The problem, as always, is that those 9.4 million people only make up around half of the total individual market. The other half (around 1.7 million on the exchanges and another 7-8 million off of the exchanges)have to pay full price for their individual policies; those folks are bearing the full brunt of the rate hikes, nor do any of them qualify for CSR assistance. That's the reason why I do my best to include all ACA-compliant policies (both on and off-exchange) when I estimate the annual rate hike averages, and I do so assuming the full, unsubsidized premium amounts.
This estimate has been strongly supported by Mark Farrah Associates, which pegs the total individual market in 2016 at around 20.5 million. (20.2 million; see update below)
Well, today, Robert Laszewski stumbled upon an excellent piece of data diving by a reporter named Steve Davis, in which Davis dug up the broken-out enrollment numbers for a whole mess of Blue Cross carriers nationwide. This data isn't comprehensive--it only covers around 23% of the total individual market; other carriers may have very different splits between the various categories of enrollees--but it's almost perfectly consistent with what I (and Laszewski, apparently) have been saying all along:
In the September 2016 issue of the trade publication, The AIS Report on Blue Cross and Blue Shield Plans, reporter Steve Davis did something no other reporter I know of has done. He called a number of Blue Cross plans and asked how many of their Obamacare individual health insurance policyholders get a subsidy and how many do not. His report covers 26 state Blues plans.
First, the administration keeps telling the press that 85% of exchange participants get a subsidy. That is technically correct but awfully misleading. I have been arguing for years that about half of the Obamacare individual market does not get a subsidy when you include all of those customers that purchase their individual health insurance policies off the exchange.
...So, how many individual health insurance policyholders are there that don't get a subsidy?
Davis surveyed a number of Blue Cross plans by calling them and asking that question and here is what he found:
Laszewski gives hard number breakouts of Davis' findings for 7 Blues companies which operate across 26 different states. In cases where the actual subsidized number isn't available, he uses the "85% of exchange-based are subsidized" figure (I've adjusted this for individual states where possible, such as Arkansas, Kansas, Louisiana, Massachusetts & Michigan). In the case of Kansas, he had all the percentages but not the grand total; I assumed BCBSKS holds around 40% of the individual market in KS based on their pre-ACA 2013 share (this has likely shifted by now but it's the best I can do), and I assumed the total KS indy market stands at roughly 260,000 people based on updated data from Mark Farrah Associates (see update below).
Plug all of the data in and here's how it looks on the spreadsheet:
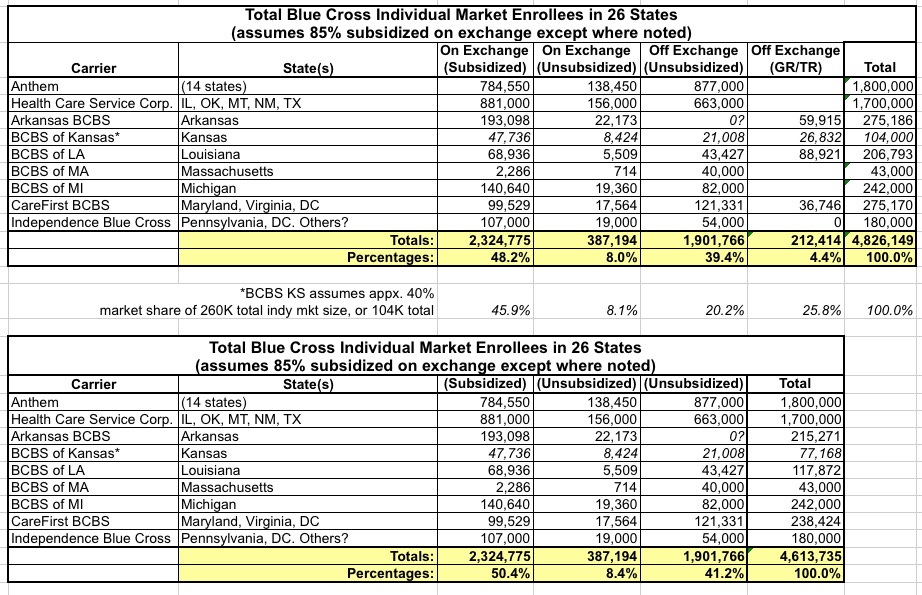
The overall picture is quite clear: Roughly 48% (2.3 million) of all individual policies sold by these carriers are subsidized, while another 48% are ACA-compliant but unsubsidized (8% on exchange, 40% off exchange). The remaining 4% or so are grandfathered/transitional enrollees.
It's important to note that in the states where there's no Grandfathered/Transitional (GR/TR) numbers listed, some chunk of the "Off Exchange Unsubsidized" tally likely belongs in the GR/TR column. Even so, the above hard data is remarkably close to my own assumptions:
- 9.4 million on-exchange subsidized (47%)
- 1.7 million on-exchange unsubsidized (8%)
- 7.1 million off-exchange unsubsidized (ACA-compliant) (35%)
- 2.0 million off-exchange unsubsidized (NON-ACA compliant) (10%)
- = 20.2 million total
The second table shows what it looks like with the non-ACA plans entirely (grandfathered/transitional), this is what it looks like...nearly a 50/50 split between subsidized and unsubsidized.
Again, here's my own assumptions with GR/TR removed:
- 9.4 million on-exchange subsidized (52%)
- 1.7 million on-exchange unsubsidized (9%)
- 7.1 million off-exchange unsubsidized (ACA-compliant) (39%)
- = 18.2 million total
UPDATE: OK, it looks like Mark Farrah Associates has revised their total indy market estimate down a bit, to 20.2 million as of March:
In February 2016, the Centers for Medicare & Medicaid Services (CMS) reported that 12.7 million consumers had enrolled in Marketplace plans following the open enrollment period. Subsequently in March, health insurers reported providing individual, non-group coverage for 20.2 million people. These updates indicate that 63% of individual medical members were enrolled through the Marketplace yet some carriers have announced plans to withdraw from exchanges next year. About 37% of this segment represents covered lives enrolled in off-exchange plans; currently an estimated 7.5 million. Many insurers are turning more attention to off-exchange membership, as they opt out of exchanges and focus on selling to people who do not qualify for premium subsidies.
Part of the problem here is normal churn/attrition. That 12.7 million "Marketplace plan" figure was actually only about 11.1 million actually enrolled in effectuated plans as of 3/31...and is probably down to around 10.8 million today...and off-exchange enrollment has likely seen similar churn. Farrah's new report doesn't even mention/distinguish the grandfathered/transitional crowd either, so I'm not sure which category I should "subtract" the 300K difference from...posibly a proportional amount from each, in which case none of the relative percentages would change anyway.
What surprises me is that Farrah uses the 12.7 million figure from February to match up against his March data even though the March exchange-based data is available here. When you plug those numbers in (for a better apples-to-apples comparison), here's what it looks like (the grandfathered and transitional figures are rough guestimates of mine, but the other columns (on exchange subsidized, on exchange unsubsidized and total indy enrollment) are all based on hard data from either the March effectuation report or the new Mark Farrah Associates report. The bold-faced grandfathered/transitional cells are based on hard numbers, and the pink "0" cells are states which did not allow transitional individual market plans in 2016):
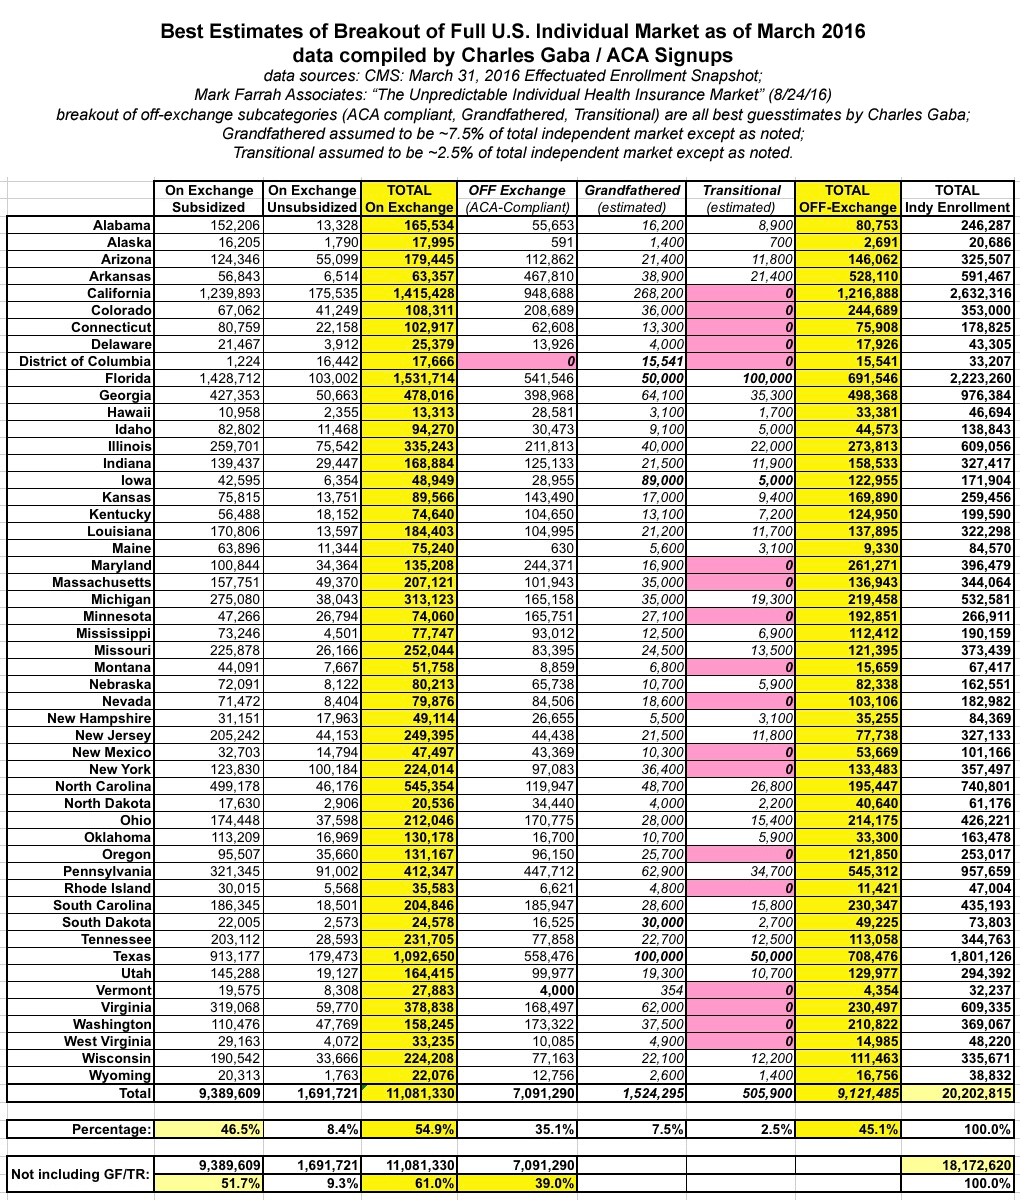
Once again, slight variances don't change the larger point: If you include GR/TR plans, about 47% of all enrollees are subsidized; if you don't include them, it's barely 51%.
Advertisement
