

IMPORTANT: Not All Percentages Are Created Equal.
Wed, 08/10/2016 - 11:26am
Over a year ago, I posted a piece over at healthinsurance.org which listed 4 questions which you should ask before freaking out over a scary-sounding "MASSIVE RATE HIKE!!" headline.
The third point was this one:
3. Consider actual dollar amounts
What are the actual old and new dollar amounts that we’re talking about here?
Remember, until now we’ve been talking purely about percentages … but that can be very misleading. In our hypothetical example, Acme is a new player on the market. They priced aggressively last year in order to steal customers away from the more familiar brand names, and managed to get 5 percent of the market; not bad.
Unfortunately, those customers turned out to be loss leaders – it’s costing them more to care for their enrollees than they’re being paid, so they jacked up their rates 25 percent this year, while Blue Cross is only raising theirs 6 percent (weighted).
HOWEVER, when you look at the average premium dollar amounts of each company, look what happens:
- Blue Cross avg. premium: $400/month + 6 percent = $424/month
- Acme avg. premium: $300/month + 25 percent = $375/month
Acme is still offering cheaper rates than Blue Cross, even with a 25 percent rate hike!
With real companies in real states, the situation is far more complicated. Some states have up to 20 companies operating on the exchange, off the exchange or both. Most companies have far more than just one policy per metal level; some are offering 20 or 30. Most of those plans have different deductible levels, co-pays, out-of-pocket maximums and so on.
I'm revisiting this because it was brought up again by Mark Nordin and "M E" in response to yesterday's Arizona post:
Mark Nordin:
Percentages are percentages of SOMETHING. That SOMETHING is important. How did Arizona's rates fall within the rest of the 50 states? Looking at the average cost of the different metal levels for 30, 40, 50, & 60 year olds for each state and calculating the averages for the entire country and identifying the outliers would be useful.
M E:
Very true. They were one of cheapest, if not the cheapest depending on age.
That said, they weren't 60% lower than the average. Also, states that aren't seeing a huge requested increase (like New Jersey, Vermont, Wyoming) generally already had the highest rates. The bad situations are the states that were already high, and who's requests are also pretty steep (Delaware, Louisiana, Montana, Nebraska....).
As I noted last year, it's very difficult to get a true picture of the "average" increases in either percentages or dollar amounts since there are so many factors, but I decided to take M E's first example (which comes from the Kaiser Family Foundation, includes 49 out of 50 states (Massachusetts is the odd man out) and looks at the average dollar amount of the premiums for a single 40-year old non-smoker living in a major metropolitian area of each state who enrolls in the Benchmark Silver plan for that area.
There are a lot of caveats in that sentence above: If they're older or younger, the rates change. The plan for a family of 2, 3, 4 or 5 will obviously be different than for a single adult. Smokers get charged a lot more in some states (this is the only "personal habit" factor allowed to be used in adjusting premiums). Big Cities can have very different rates than rural areas. And, of course, in some areas there are dozens of different plans across all 4 metal levels of actuarial value.
HOWEVER, let's see what happens for that single 40-year old in each state (etc, etc) on that Benchmark plan, assuming that all of the requested premium hike averages I've estimated were apply. How does that look?
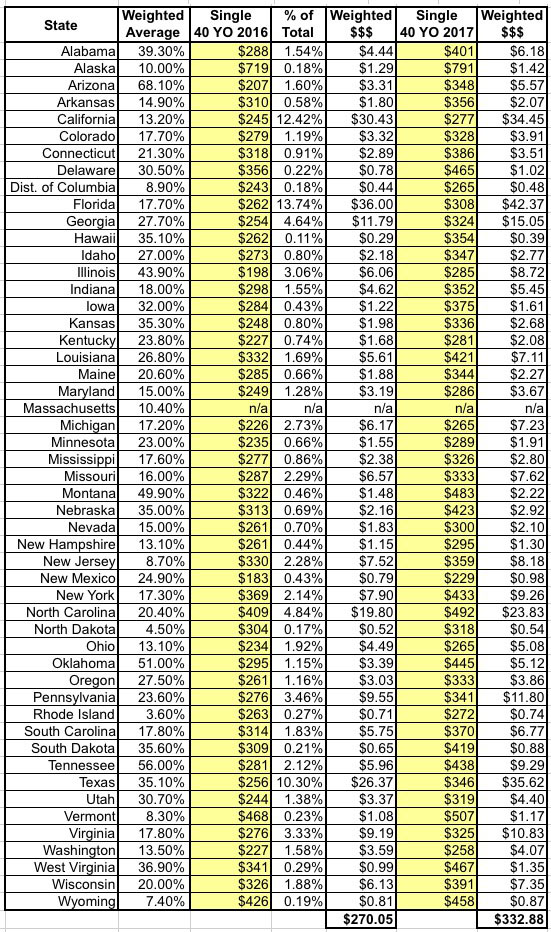
Nationally, the weighted average comes in at $333/month for 2017, or 23.3% higher than the $270 they'd be paying on average this year...the same 23.3% I've been estimating all along.
However, look at the actual dollar amounts for each state, which is ultimately more important. I've sorted the table out from lowest requested rate hikes (Rhode Island) to highest (Arizona):
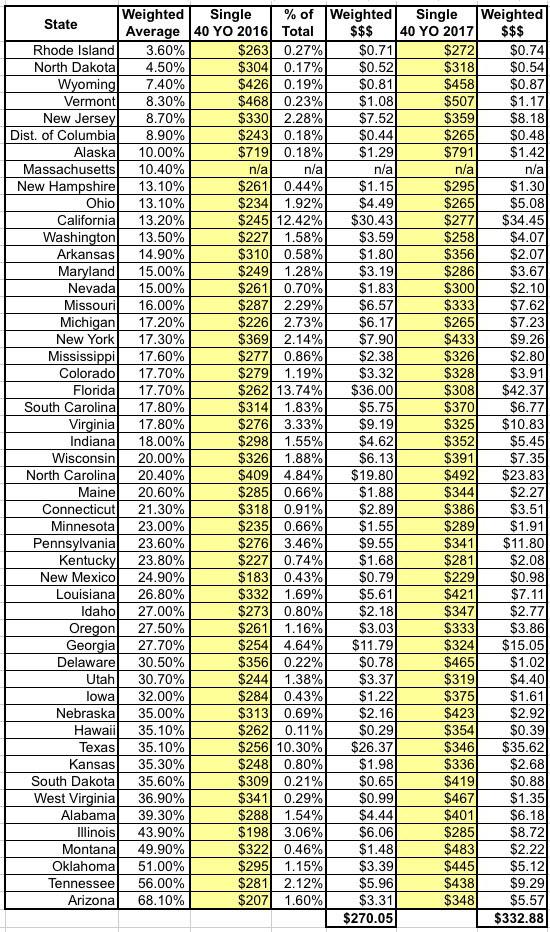
Rhode Island only goes up 3.6%, and now stands at $272, which (while still 18% lower than the national average of $333) is still higher than 5 other states.
New Mexico goes up 24.9%, but they were so dirt cheap (relatively speaking) to begin with, this still leaves them at just $229/month, the lowest rate in the nation.
At the other extreme, Arizona may have shot up 68%...but again, they started out as the 3rd lowest rate, so even this hefty hike leaves them right in the middle of the pack at $348/mo.
Alaska, meanwhile, only goes up 10% (thanks to a last-minute state-level reinsurance program agreed to by the state legislature)...but they were already absurdly high to begin with, so they're still at a whopping $791/month, over 50% higher than the next-highest state (Vermont's $507).
The point of all of this is that all of these changes are relative to not only what people were paying the previous year, but also to other circumstances (the cost of living in downtown Manhattan is a hell of a lot different from, say, rural Mississippi, for instance).
Advertisement
