

How accurate is this chart? A closer look... (UPDATED)
Sat, 07/09/2016 - 12:22am
FIRST THINGS FIRST: My deepest sympathies to the families, friends and co-workers of the 5 police officers murdered in Dallas last night (as well as Alton Sterling, Philando Castile and all other victims of gun violence)...and my wishes for a full and speedy recovery to the other seven officers who were shot.
This is a pretty grim topic, but given how much misinformation is flying around out there, including a lot of statistics and numbers, it's important to get this stuff right.
Last October, I wrote an entry which focused on an interesting chart posted by National Review Online regarding the downward trend of gun homicides vs. the upward trend of gun sales over the past couple of decades. My conclusion was that NRO's main claim was accurate...but that they had massively exaggerated the degree to which it was true.
Earlier this evening, someone on Twitter posted the following graphic, which has been retweeted over a thousand times as of this writing:
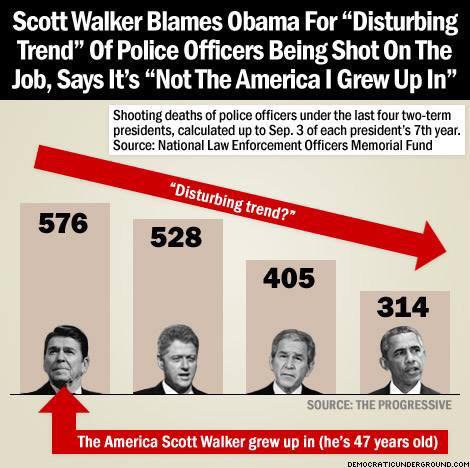
OK. Taken at face value, this obviously makes it look like, contrary to the Republican Party's claims, President Obama has not only not overseen a massive surge in shootings of police officers, but that the rate has actually dropped dramatically under his watch compared to earlier Presidents.
First of all, let's check the source of the data: It's from the National Law Enforcement Officers Memorial Fund. When you go to the appropriate place on their website, they do indeed list a total of 314 police officers shot to death since President Obama took office in January 2009. However, that only runs through 2014. 2015 and the first half of 2016 aren't included (and certainly the 5 Dallas PD officers killed last night haven't been added to the tally yet). I'm not sure where they got the data for the earlier years, since the link above only goes back to 2005. However, the NLEOMF site does include this report (published in December 2015) which does give the average number of firearm-caused officer deaths per year by decade, and that does show a gradual reduction from 87/year in the 1980's to 53/year in the 2010's, so I'm willing to accept that the numbers above, for President's Reagan, Clinton, Bush Jr. and Obama are accurate (except, again, that the 314 figure attached to Obama appears to be missing a year and a half of data).
Actually, that's even more confusing because these numbers are supposedly "up to Sept. 3rd of each President's 7th year". What's that about? Why Sept. 3rd instead of Dec. 31st...or at the very least, Sept. 30th (end of Q3)? Why the 7th year instead of the full 8 years? That's such an oddly arbitrary cut-off date. That being said, "Sept. 3rd of the 7th Year" basically means 6.67 years each.
In addition, where's George H.W. Bush? I know he only served one term, but this also raises another point: Since Obama still has half a year to go, and the data was cut off at the end of 2014, instead of using the raw number, this chart should use the average number per year...which would also let them include George Senior's 4 years.
If you do that, dividing each number by 6.67 gives you 86/year for Reagan, 79/year for Clinton, 61/year for Bush Jr. and 47/year for Obama...an average annual reduction of about 45%. I still don't know what it was under HW Bush, but the point stands: Yes, the average number of police officers shot to death during President Obama's terms in office is indeed only 55% that of what it averaged under President Reagan.
The next major factor which has to be accounted for is population growth. There were only about 230 million people in the U.S. when Reagan took office in 1981. This has grown to about 322 million today...about 40% higher. When you adjust for that growth, shooting deaths of police officers have dropped even more dramatically from Reagan to Obama...by roughly 60% per capita (from 1 for every 2.67 million Americans per year to 1 for every 6.85 million).
So, this means that things have actually gotten a lot safer for police officers in recent years, right? Well...sort of.
Remember, the numbers above only reflect officers killed by being shot, not those who suffered nonfatal shots. Medical technology has advanced tremendously over the past 35 years, so it's entirely possible that the rate of officers being shot hasn't changed at all (or perhaps has even gone up)...it's just that doctors have a much better chance of saving their lives when it happens. I have no idea how badly injured those other 7 officers in Dallas were, but my guess is that at least some of them are only alive today because of improvements in medical technology and newer techniques.
Don't get me wrong: It's obviously a good thing that officers (and civilians) are less likely to die if they are shot...but it's still important to put statistics like the one above in context. I have no idea how many non-lethal shootings of officers there are each year. The closest I've found is this Boston.com story from January 2016 which says that the number of police officers "feloniously killed" (which has also gone down slightly on average since 2005) or "assaulted by firearms" (which has stayed roughly the same for the past decade)...except that it's possible from the wording that "assaulted by firearms" may include being bludgeoned with a gun as opposed to being shot:
There were 1,950 firearm assaults on officers in 2014, the second-lowest number in the 10-year period. Just a year earlier, though, there were 2,299 firearm assaults on officers, the highest in this 10-year period.
In other words, the odds of an officer dying from a gunshot wound have dropped 60% since 1981...but it sounds like just as many are being shot at all each year as in 2005. Even if the hard number itself has stayed perfectly even since 1981, however, this rate has still gone down significantly when adjusted for population growth.
In other words, Scott Walker, while you're absolutely correct that this "isn't the America you grew up in", that isn't because police officers are more likely to die of a gunshot wound.
UPDATE: Thanks to dKos commenter JML9999 for pointing out one more major unknown factor: Improvements in body armor/Kevlar vest technology over the years which have reduced the number of officers who have actually been wounded by gunshots (even if they were still shot at and heavily bruised in many cases):
In 1976, Richard Davis, founder of Second Chance Body Armor, designed the company's first all-Kevlar vest, the Model Y. The lightweight, able vest industry was launched and a new form of daily protection for the modern police officer was quickly adapted. By the mid-to-late 1980s, an estimated 1/3 to 1/2 of police patrol officers wore able vests daily. By 2006, more than 2,000 documented police vest "saves" were recorded, validating the success and efficiency of lightweight able body armor as a standard piece of everyday police equipment.
The source for the Kevlar stats above are a bit fuzzy, and even assuming they’re accurate, “more than 2,000 between 1976 and 2006” doesn’t give you any idea of how many “saves” there were per year, meaning that figure isn’t particularly helpful. However, it’s pretty safe to assume that an increasing number of officers have been wearing Kevlar vests as time has gone on, and that the penetration-stopping power of the vests has also increased over time, all of which strongly suggests that at least some of the reduction in the rate of police being shot can be accounted for by this.
Advertisement
