

Commonwealth Fund study compares on vs. off exchange policies & has some interesting conclusions...
Tue, 06/07/2016 - 3:59pm
Ever since my infamous clash with Avik Roy over the "how many exchange enrollees are newly insured?" brouhaha over two years ago, one issue which has always been kind of fuzzy has been the question of exactly how many OFF-exchange individual healthcare policy enrollees there are. Since most carriers don't like to break out their enrollment numbers in too much detail for competitive/trade secret reasons, and many states don't require them to do so, this makes tracking the off-exchange numbers pretty difficult.
Having said that, Mark Farrah & Associates (via the Kaiser Family Foundation) has done the legwork to try and figure this number out, and according to them, after floating between 10.6 - 10.9 million for several years prior to the ACA exchanges launching, the total individual market (which includes exchange-based and OFF-exchange enrollees) shot up to 15.6 million in 2014.
According to this study:
The insurance company filings do not break down whether coverage was purchased through a Marketplace or in the outside market, nor whether coverage was first purchased after January 1, 2014 and therefore subject to the new ACA insurance market rules. However, juxtaposing these enrollment figures with the federal government’s estimate of 6.7 Marketplace enrollees as of October 15, 2014 suggests that about 43% of all individual market coverage was purchased through the marketplaces in 2014. It also means that new enrollment in the individual market among those who would have otherwise been uninsured likely took place inside the Marketplaces, driven by the availability of premium subsidies. Among those signing up for Marketplace plans in 2014, 85% qualified for premium subsidies.
OK, so 43% exchange-based (6.7 million), 57% off-exchange (around 8.9 million). However, that off-exchange number is further complicated by the fact that it includes several million grandfathered and transitional policy enrollees. As a reminder:
- Grandfathered Policies (GF): Originally enrolled in prior to March 2010; people enrolled in these plans are allowed to stick with them as long as they wish (or until the carrier decides to discontinue those policies).
- Transitional Policies (TR): Originally enrolled in between March 2010 - October 2013 (or even as late as December 2013 in some states)...but only in about 2/3 of the states, and even then, only certain policies from certain carriers.
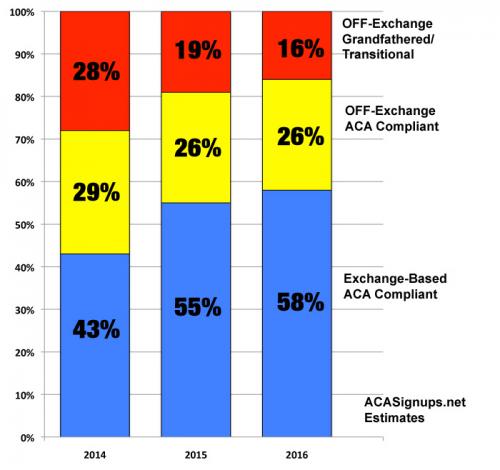
How many of those 8.9 million off-exchange enrollees were ACA-compliant as opposed to being GF/TR? No one seems to be quite sure, but until now, the limited data I had suggested that it was perhaps half and half...which would break out like so in 2014:
- Exchange based, ACA compliant: 6.7 million (43%)
- OFF Exchange, ACA compliant: 4.5 million (29%)
- OFF Exchange, GF/TR: 4.4 million (28%)
If you subtract the GF/TR enrollees and look strictly at ACA-compliant policies, this would mean roughly a 60/40 split On vs Off-exchange.
In 2015, there were roughly 9.3 million people enrolled in exchange policies as of September. The total individual market had grown further, although not as dramatically as it did in 2014. The exchange-based market grew partly due to newly enrolled people but also due to people shifting from off-exchange policies to exchange-based, and as GF/TR policies were discontinued or dropped for various life change reasons. I had it estimated at perhaps 17 million people, broken out like so:
- Exchange based, ACA compliant: 9.3 million (55%)
- OFF Exchange, ACA compliant: 4.5 million (26%)
- OFF Exchange, GF/TR: 3.2 million (19%)
Without the GF/TR policies, this would be roughly a 67/33 split On/Off.
So what about 2016? Well, there should be around 11.0 million people currently enrolled in effectuated exchange-based QHPs, plus up to 8 million off-exchange enrollees (after accounting for attrition), according to various reliable sources, including the CBO. That would bring the grand total up to around 19 million. As for GF/TR enrollees, as far as I can tell, those should be down to around 2.5 million at most as of today, although other sources suggest it's higher, perhaps 3 million. This would break out like so:
- Exchange based, ACA compliant: 11.0 million (58%)
- OFF Exchange, ACA compliant: 5.0 million (26%)
- OFF Exchange, GF/TR: 3.0 million (16%)
...or roughly 69/31 on/off without the GF/TR enrollees.
All of this brings me to the headline above: The Commonwealth Fund just issued a study about exchange-based vs. off-exchange policies, and while the trend is similar, the actual percentages and hard numbers are quite different:
The Affordable Care Act does not require insurers to sell through the new insurance exchanges, or marketplaces.1 Although subsidized insurance for individual policies is available only through the exchanges, insurers can choose to sell outside of the exchanges to people who do not qualify for or claim premium subsidies.
Actually, while footnote #1 claims that DC is the only exchange which requires all indy/small group policies be sold via the ACA exchange, Vermont has also had this policy in place since the exchanges launched. Unless I've missed something, this policy hasn't changed.
Market Shares
Because the ACA’s premium subsidies are available only through the federal and state exchanges, it is no surprise that the great majority of ACA-compliant coverage in the individual market is sold through the exchanges. For 2016, insurers project that only 17 percent of their anticipated 15 million ACA-compliant subscribers will purchase plans sold off of exchanges.3 There has been a steady decline of projected nonexchange enrollment since 2014 (Exhibit 1).
They also include the following footnote to account for the GF/TR enrollees:
2 These data do not include grandfathered or other noncompliant plans in which people have renewed their enrollment from 2014. In 2015, such plans accounted for only 16 percent of individual market enrollment, which is half the level of the previous year. L. Hamel, M. Norton, L. Levitt et al., Survey of Non-Group Health Insurance Enrollees, Wave 2 (Henry J. Kaiser Family Foundation, May 2015).
OK, so Commonwealth is claiming that as of 2016 there are only 15 million ACA-compliant enrollees total, about 1 million fewer than the 16 million I have estimated above. Fair enough. They're also stating that GF/TR enrollees made up about 32% of the total individual market in 2014 and 16% in 2015. they don't include an estimate for this year, but assuming the 3 million estimate is accurate, it should be around 15% (?)
However, they then display a bar graph which breaks out as follows (but only includes ACA compliant policies):
- 2014: 73/27 On/Off
- 2015: 80/20
- 2016: 83/17
If you reverse the calculation to include the GF/TR enrollees, you would get something close to this:
- 2014: 50% ON exchange, 18% OFF-ACA, 32% GF/TR
- 2015: 67% ON exchange, 17% OFF-ACA, 16% GF/TR
- 2016: 70% ON exchange, 15% OFF-ACA, 15% GF/TR
Here's how my estimates and the Commonwealth Fund's estimates look visually, when you include grandfathered/transitional policies in the mix:
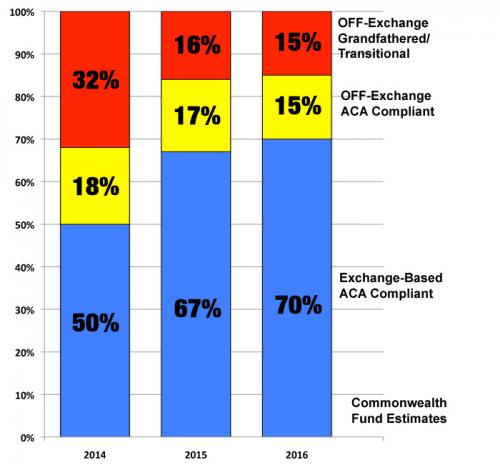
On the one hand, it probably doesn't matter much which estimate is more accurate, since the overall trend is still obviously towards the exchanges squeezing out the other two categories. On the other hand, the large discrepancy did bother me...until I read this:
About This Study
Data come from the “unified rate review template” (URRT) spreadsheets for 2016 that insurers must file with CMS’ Center for Consumer Information and Insurance Oversight (CCIIO), documenting how they develop their premium rates for ACA-compliant plans. The URRT includes two sections: the market-level analysis section, which develops a projected single risk pool rate from prior experience data; and the product/plan section, which reports projected premiums and enrollment for the coming year, in each health plan. This database provides the change in premium per member for plans offered on and off of marketplace exchanges, as well as the components of costs (claims, administrative) and profit margins driving premium changes.
There were 543 unique insurers in different states. We used projected membership to classify insurers and products as selling predominantly on exchanges versus outside of the government exchanges. For plans sold on exchanges, insurers also must offer these plans outside of the exchanges. Therefore, some “on-exchange” plans also have off-exchange enrollment. However, because the majority of enrollees receive subsidies that are available only through the exchanges, enrollment in these plans is predominantly on-exchange and therefore the exchange dynamics determine the pricing of these plans even when sold off exchange.
OK, so some unknown portion of the Commonwealth Fund's estimates are off-exchange after all...which helps explain the gap between my estimates and theirs.
Anyway, the Commonwealth study also comes to some other interesting conclusions about the differences between ON and OFF exchange ACA-compliant policies:
We compared the projected medical loss ratios in 2016 for insurers that sell all of their products on the exchanges with those that only sell off of the exchanges.4 To minimize the effect of outliers, we report median rather than mean values. As shown in Exhibit 2, insurers selling exclusively off of the exchanges project a median medical loss ratio that is two percentage points lower than those that sell on the exchanges. This reduced loss ratio is largely accounted for by greater administrative costs: median administrative costs are 2.5 percentage points higher off of the exchanges. Also, median profit ratios are almost one point higher off of the exchanges.
In other words, OFF exchange plans have higher administrative costs...but lower taxes/fees, since there's an extra fee for participating on the exchanges.
We also analyzed how insurers projected their enrollment and premiums would change in 2016, based on the type of provider networks offered.6 As shown in Exhibit 3, premiums increased somewhat more for plans sold off of the exchanges than for those sold on them ($48 vs. $40 per member per month). In large part, this lower premium increase among exchange plans appears attributable to a shift of enrollment toward HMO and “exclusive provider organization” (EPO) plans that limit coverage to contracted provider networks except in emergencies, and away from PPOs or “point of service” (POS) plans that include out-of-network coverage.7 Also shown in Exhibit 3, premiums increased substantially more for PPO/POS plans than for HMOs and EPOs, both on and off the exchanges. The plan-type differential was especially large on exchanges, where PPO/POS premium increases were 77 percent greater than for HMOs/EPOs ($53 vs. $30 per member per month).8
In other words, it's not so much that off-exchange plans are becoming more expensive more quickly, it's just that exchange enrollees are shifting from PPOs to HMOs more quickly than off-exchange enrollees, which means a slower increase rate.
There's a few other key findings; check it out!
Advertisement
