

A (very rough) visualization of how the individual market has changed under the ACA
Fri, 03/25/2016 - 2:33am
I want to make one thing very clear right off the bat: Some of the numbers in this post are very rough estimates, a combination of hard data and guesstimates extrapolated from the information I have on hand from the Kaiser Family Foundation, the Congressional Budget Office and the HHS Dept.
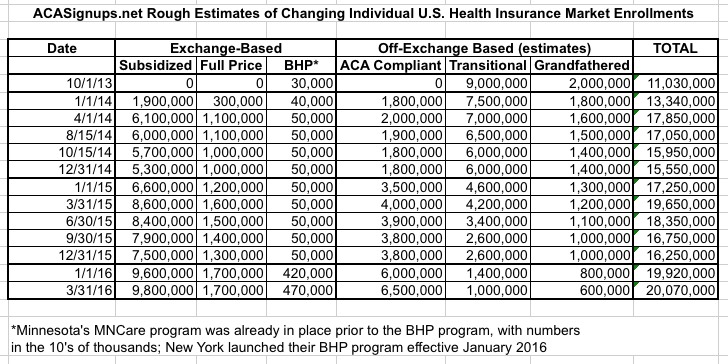
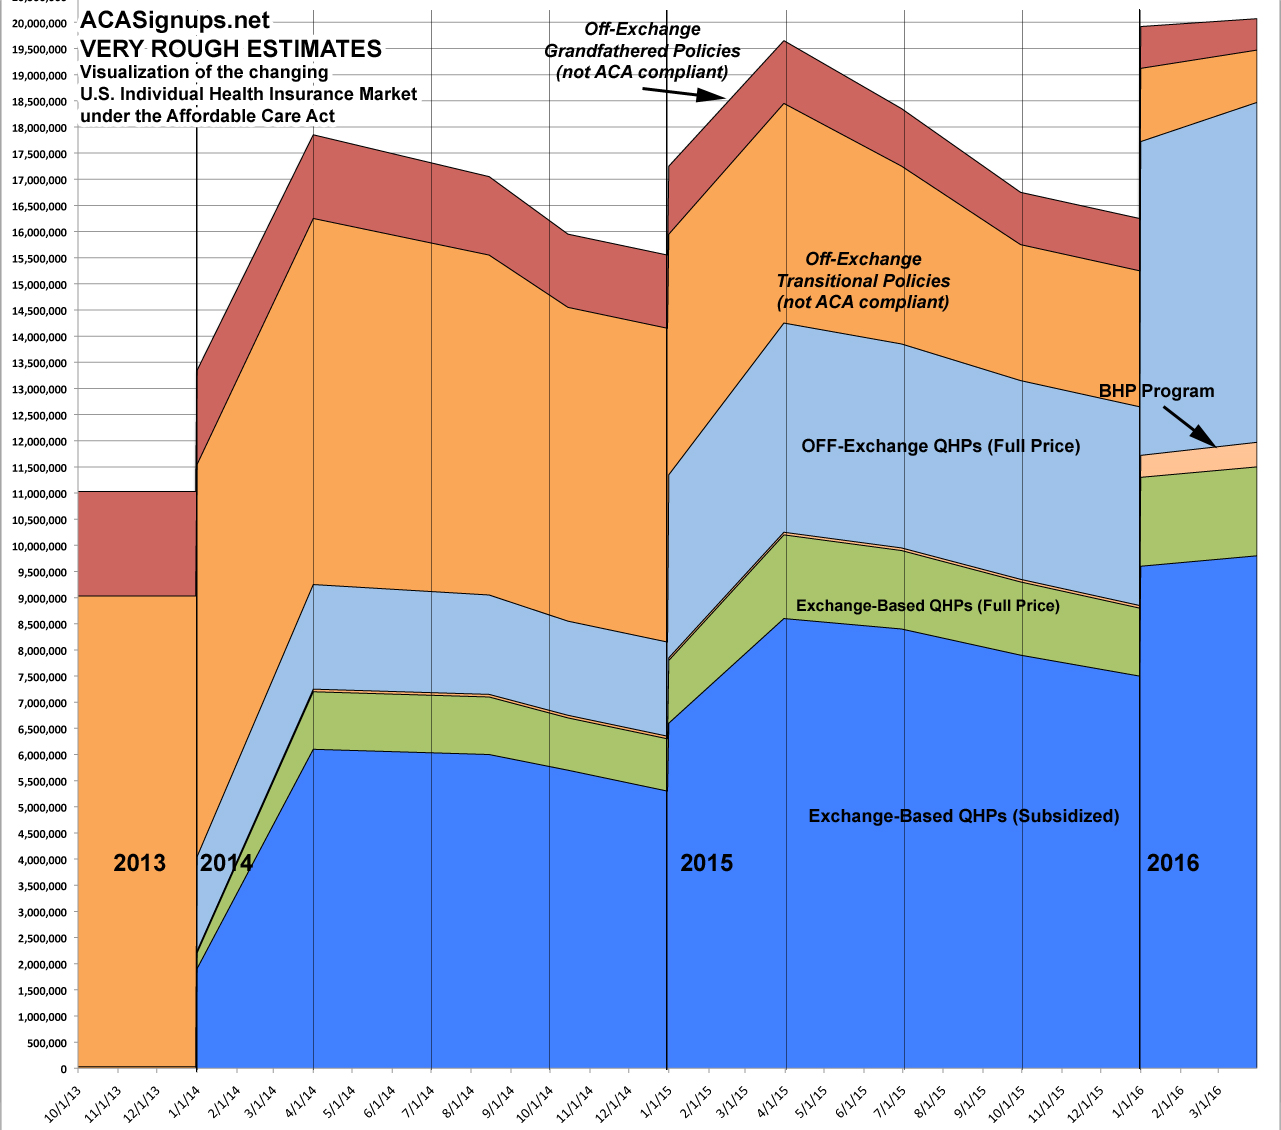
Having said that, here's a crude table and "stacked area" chart depicting how the U.S. Individual Health Insurance Market has changed over the past 2 1/2 years, from the launch of the ACA exchanges in October 2013 through the end of March 2016.
As you can see, there are 6 columns/sections: Three exchange-based (subsidized QHPs, full price QHPs and Basic Health Plan enrollments) and three OFF-exchange (ACA compliant, "Transitional" and "Grandfathered").
For the exchange-based columns, I used hard numbers based on the number of paid QHP enrollments as of the listed dates, which are generally about 10-12% lower than the total number of policies selected. These numbers drift downwards somewhat as the year progresses due to attrition as people drop off their policies, as well as getting kicked off for non-payment or legal residency verification issues, before shooting back up again in the early part of the following year. The same thing happens to a lesser extent for the ACA-compliant off-exchange policies.
The Basic Health Plan column has nominal numbers prior to 2016 since only Minnesota had BHP in place, with fewer than 100,000 enrolled at any point; it wasn't until this year that the BHP numbers became large enough to register on the chart (thanks to New York launching their version of the program).
The non-compliant transitional and grandfathered columns, on the other hand, have dropped steadily throughout the entire 2 1/2 years, since no new policies of these types are allowed anymore.
Again, the exact numbers may be off by a few hundred thousand here and there, but in general, this shows how things have progressed: The total market size has nearly doubled (from 11 million in 2013 to over 20 million today), but the portions of that growing total have shifted, with ACA-compliant plans (both on and off-exchange) gradually eating away at the transitional/grandfathered sections. Within another year or two the transitional/grandfathered columns should disappear entirely, but as the CBO noted in their report yesterday, things will likely stabilize with roughly 3/4 of the total individual market being on-exchange (they're projecting the number to max out at 19 million including BHPs) and around 1/4 off-exchange (CBO projects this to settle at around 7 mllion), give or take:
Advertisement
