

HC.gov Week 11 Snapshot: 154K; reducing OE3 projection to 13.6-14.0M...but THE PURGE FACTOR HAS BEEN CONFIRMED!
Wed, 01/20/2016 - 2:15pm
Here's what I wrote a few days ago:
The national total was around 11.50 million QHP selections as of January 9th. Since I won't know how big of a difference the "Live Purge!" factor is making until well after the end of March (when the Q1 effectuation report comes out), I still have to work within the confines of how CMS has been reporting enrollments this season.
With that in mind, I've dropped my end-of-OE3 projection down from 14.7 million to somewhere between 13.8 - 14.2 million (call it 14.0 million even for simplicity).
In order to hit 14.0 million total, 2.5 million people will have to enroll in the final 3 weeks, most likely broken out something like:
- Week 11: 400K nationally (300K via HC.gov)
- Week 12: 400K nationally (300K via HC.gov)
- Week 13: 1.7M nationally (1.3M via HC.gov)
Note that this assumes Week 11 and 12 are about the same. This is because Week 11 includes tomorrow's February coverage deadline (which should have a small bump), while Week 12 is obviously closer to the final March coverage deadline. After that it would be all about the big final week, which would have to come close to the mid-December frenzy (Week ) to hit the 14 million mark. Of course, if that were to happen, CMS would probably also tack on another couple of "overtime" days like they did in December, which could bump the final number up further...but really, I just don't see that as likely.
If the Week 11 Snapshot comes in any lower than 250K, I'll likely drop my final projection further, to somewhere between 13.6 - 14.0 million.
Here's the Week 11 HC.gov Snapshot report, released just moments ago:
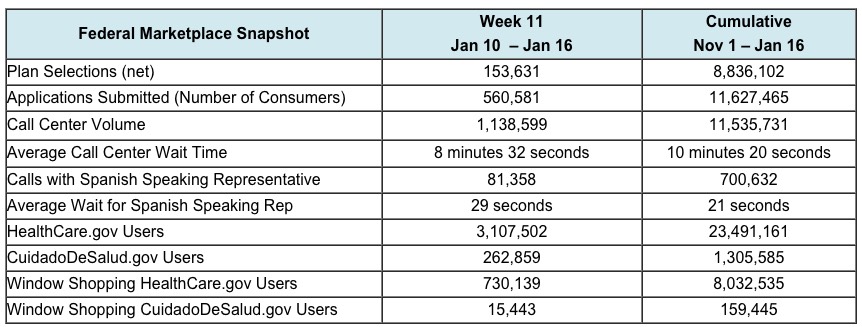
I noted yesterday that the Rhode Island exchange managed to double their weekly enrollment numbers last week, but that HC.gov would have to quadruple theirs (from 74,000 to around 300K) in order to stay on track for a 14.0 million total. Instead, HC.gov's numbers also only doubled to around 154,000.
This likely means that only around 200,000 people have been added nationally in the past week, which in turn means that the grand total has likely just now reached 2015's 11.7 million.
On the one hand, this is good news in the sense that there's still 2 full weeks to go before the end of open enrollment; the bad news is that while the final total will obviously be higher than last year, it's not likely to hit the 25% increase that I was expecting. A net increase of perhaps 16-20% (13.6 - 14.0 million) is now looking more realistic.
HOWEVER, there's still a very important caveat to all of this: The "Million Missing Enrollees" Purge Factor.
Take note of this vitally important section of the press release:
As we have previously noted, this year the number of net plan selections accounts for both insurer and consumer-initiated cancellations that occur before the end of Open Enrollment. This is a change from last year, and it will result in a larger number of cancellations being accounted for during, rather than after, Open Enrollment. Last year, cancellations from insurers that happened during Open Enrollment were reflected only in reports on effectuated enrollment after the end of Open Enrollment. As a result, there will likely be a smaller difference this year between plan selection totals at the end of Open Enrollment and subsequent effectuated enrollment.
To provide a clearer picture of underlying enrollment trends, starting this week, we are including the weekly net new plan selection total. This number is in addition to the plan selection total we have been reporting each week, which includes both new and returning consumers. Net new plan selections take into account new plan selections in the reporting week minus any consumer or insurer-initiated cancelations for new plan selections.
Overall, net plan selections for Week 11 totaled 153,631. Over the same time period, net new plan selections totaled 399,885, about the same as the similar week during last year’s Open Enrollment. Cancelations reflected in the net plan selection number for this week were by and large insurer-initiated cancellations of returning consumers who were automatically enrolled for 2016 but actually had their policies terminated at the end of 2015.
VINDICATION!!
That's right: The actual "apples-to-apples" number to compare with last year is 399,885, not 153,631!
That's 246,254 additional QHP selections which would have been included in the total if CMS hadn't "pre-purged" them...and that's just for Week 11 alone.
I can't overstate how important this clarification is. In a single week, nearly 250,000 "missing" enrollees have been "found" across the 38 states covered by HC.gov.
The only thing which is still confusing me here is that last year's Week 11 Snapshot report wasn't around 400K; it was only 180K. However, it sounds like CMS's reference to "similar week last year" actually refers to Week 9 (400,253).
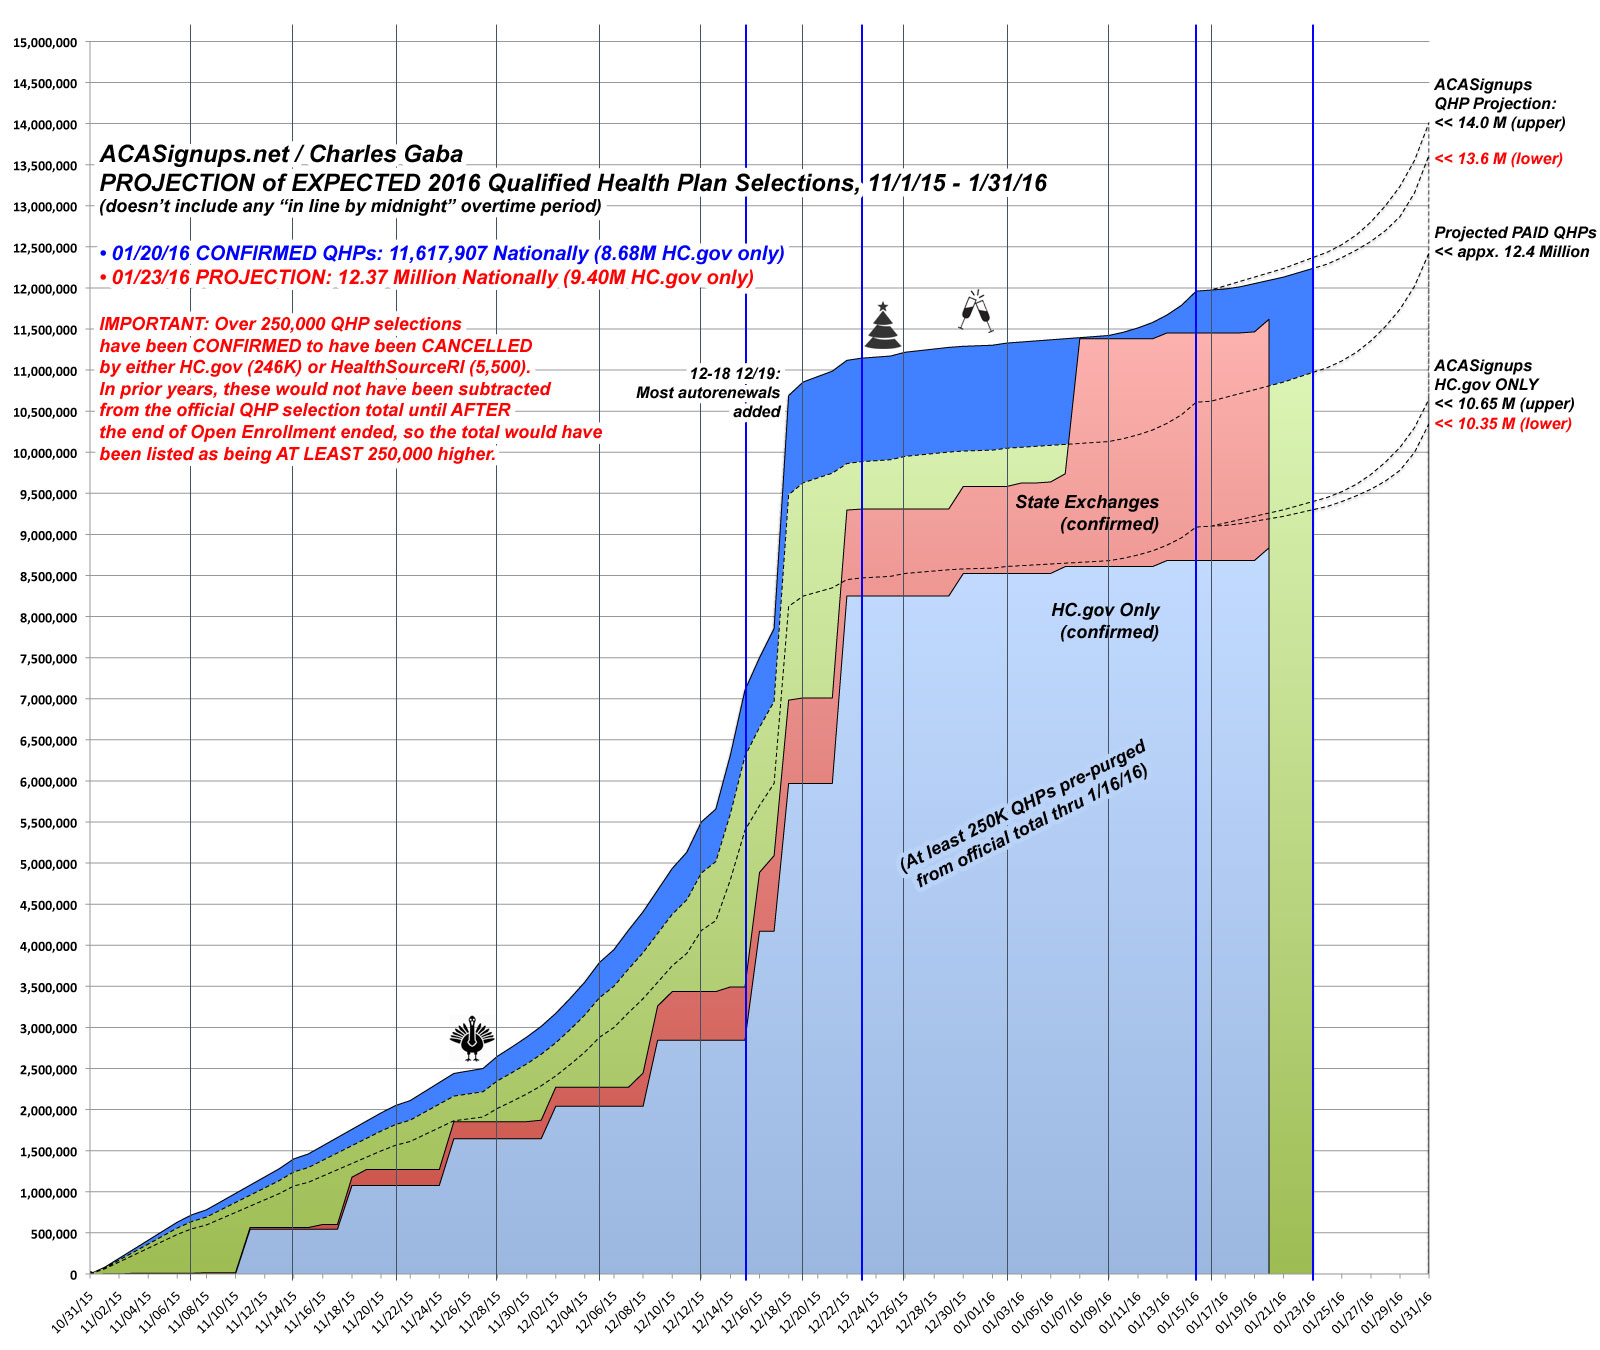
As I noted in my "Million Missing" post, this "purge" factor completely messes up my methodology for The Graph, since there's up to a million-enrollee "unknown" factor going on here.
Furthermore, it also means that I can no longer use the "75/25" rule of thumb when trying to extrapolate HC.gov numbers nationally...because the "purging" is only being done for HC.gov, not for Covered California or most of the other state-based exchanges (Rhode Island and Massachusetts are doing this to varying degrees as well, however).
Finally, while it's great that they gave the "pre-purged" number for Week 11, the "missing" numbers for Weeks 1-10 are still a mystery. I'm guessing these were much smaller, perhaps 100K or so combined, but it'd be great to have that as well.
In short, the "official" QHP Selection total could end up being as low as 13.0 million and I could still be proven "correct" with my original 14.7 million estimate...but there's still really no way of being certain.
What this does mean is that at least 250,000 people who would otherwise have appeared to "drop" coverage between 1/31 and 3/31 have actually already been pulled from the tally, meaning a "cleaner" number for March.
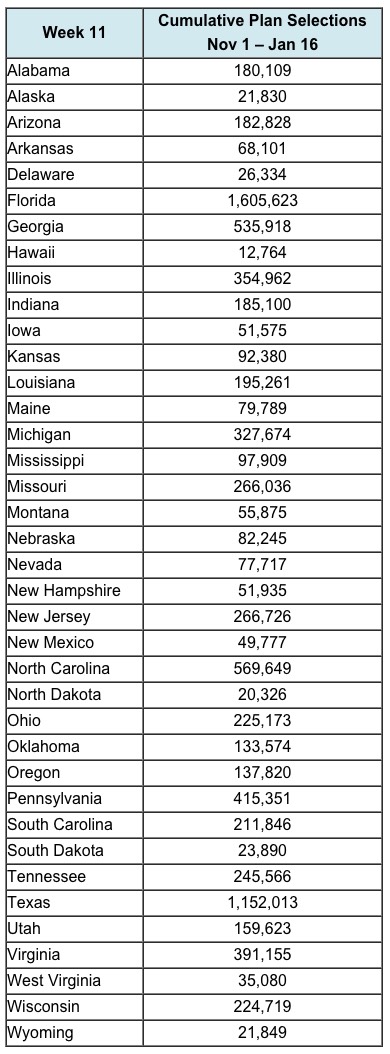
(sigh) Anyway, here's the state level numbers (which, unfortunately, don't include the "pre-purged" numbers for comparison, for either Week 11 or any of the prior weeks).
UPDATE: Here's the updated Graph, with Week 11 included and Week 12 projected. The most notable change is the addition of a bold notice regarding the 250,000+ purged QHP factor.
Advertisement
