

STATE BY STATE: 30 states running ahead of projections, 12 running behind
Wed, 01/06/2016 - 3:27pm
I launched the "State by State" chart feature towards the end of the 2015 Open Enrollment period last time around, and it proved to be pretty popular, so I've brought it back this year.
It's important to note that I'm still missing data from some state exchanges; I have bupkis from DC, Kentucky, New York or Vermont. I also only have partial data from others (California includes new enrollees only, while several other states only have data for the first couple of weeks).
With all those caveats out of the way, here's where things stand. Just like last year:
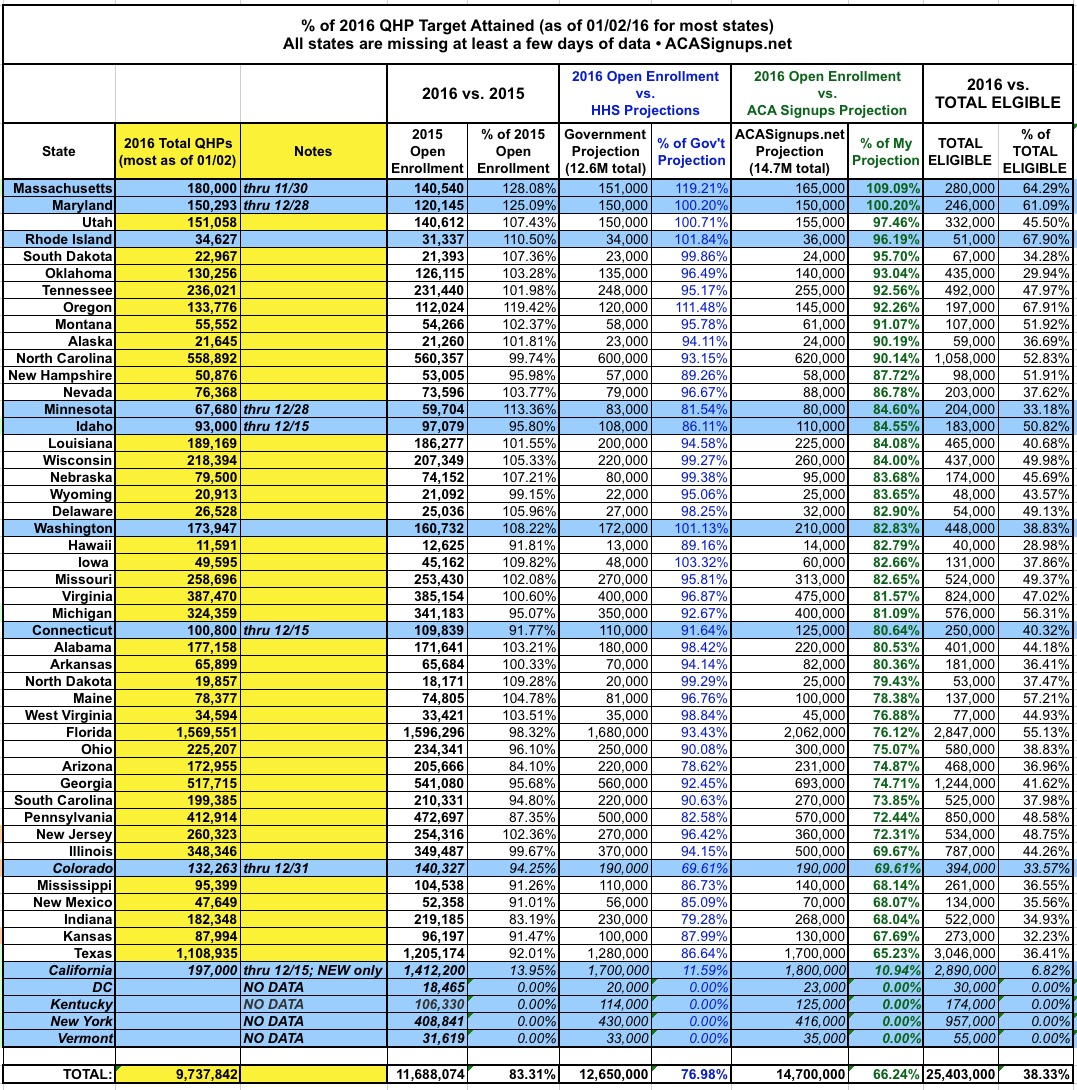
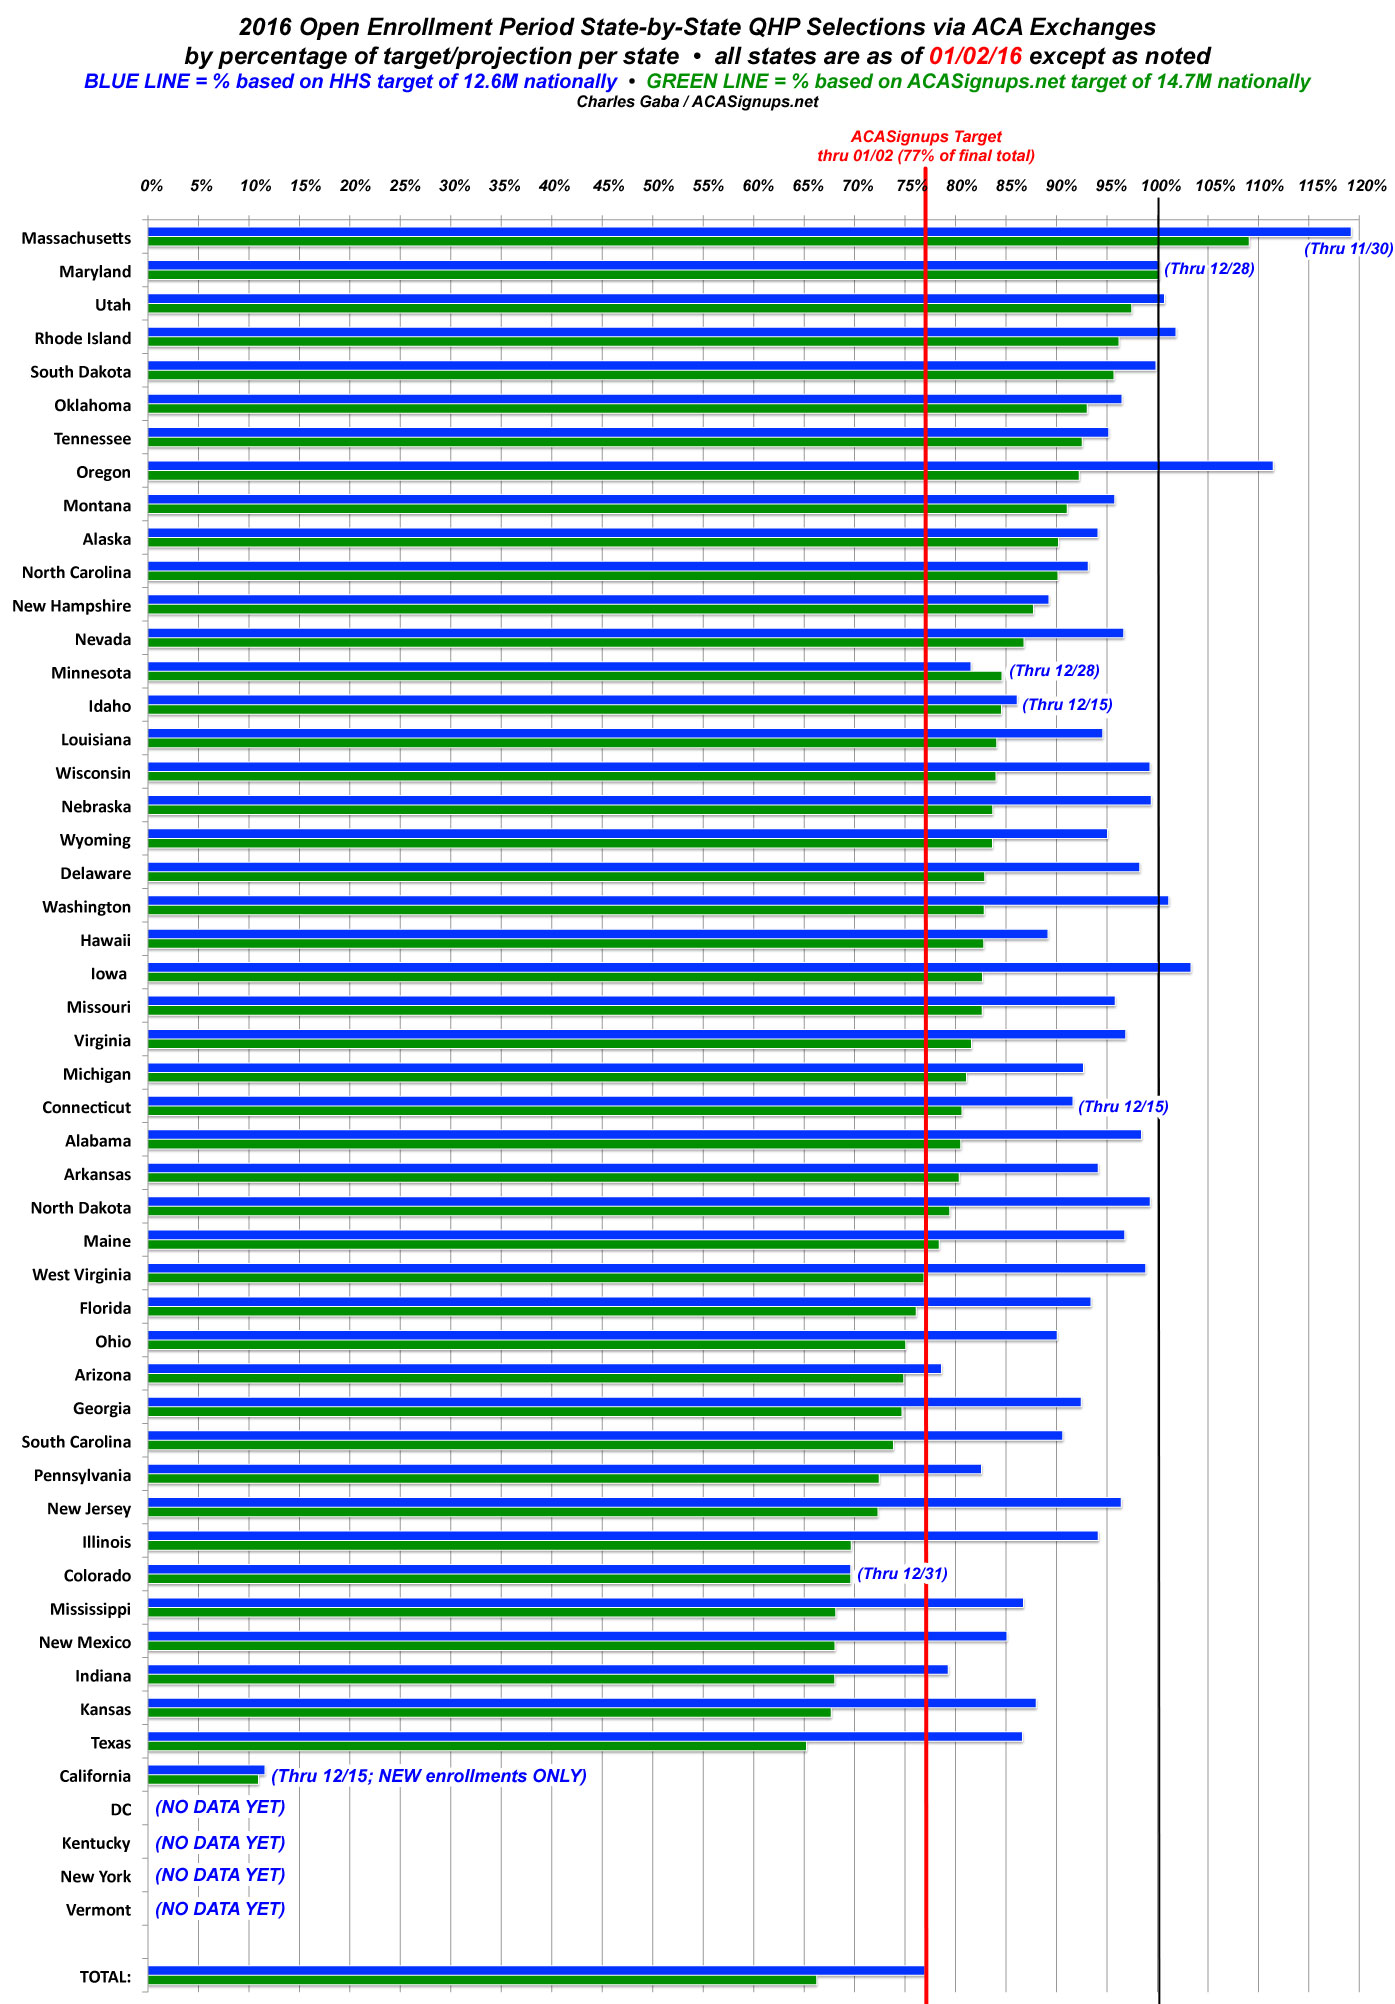
- The BLUE LINES represent the percentage of QHP selections each state had achieved as of January 2nd for most states compared to my best guess at their reasonable proportion of the 12.6 million people the HHS Dept. expects to select plans nationally. In some cases (California, Colorado, Connecticut, Idaho, Maryland, Minnesota and Vermont), I've used the official target number for that state, according to the exchange itself. For other states, I took a proportionate number based on the HHS Dept's 12.6 million total.
- The GREEN LINES, meanwhile, represent MY personal projection of how many people I expect to select QHPs during open enrollment this year. Again, with the exception of CA, CO, CT, ID, MD, MN & VT, none of these targets are official.
- Finally, I've included a vertical RED LINE. This represents the point I think each state should have been as of January 2nd (around 11.32 million total, or 77% of the 14.7 million total I'm projecting nationally by January 31st).
There are 30 states running at least 2 points ahead of where I expected them to be as of January 2nd (ie, 79% of my projections or more):
- Massachusetts, Maryland, Utah, Rhode Island, South Dakota, Oklahoma, Tennessee, Oregon, Montana, Alaska, North Carolina, New Hampshire, Nevada, Minnesota, Idaho, Louisiana, Wisconsin, Nebraska, Wyoming, Delaware, Washington, Hawaii, Iowa , Missouri, Virginia, Michigan, Connecticut, Alabama, Arkansas & North Dakota
Unfortunately, there are also, 12 states are running at least 2 points behind where I expected them to be at this point (ie, 75% or lower):
- Arizona, Georgia, South Carolina, Pennsylvania, New Jersey, Illinois, Colorado, Mississippi, New Mexico, Indiana, Kansas, Texas
(Note that until now I've defined "ahead/behind" as as +/- more than 5 percentage points; as we approach the finish line, I'm tightening this up to +/- more than 2 percentage points).
While there are 2.5x as many states running ahead as behind at the moment, it's important to note that the "behind" column includes major states like Illinois and especially Texas, which is about 200K lower than I was figuring.
In terms of what behind the "lagging" numbers in these 12 states, the biggest missing factor I can think of for Pennsylvania and Indiana is that ACA Medicaid expansion was launched in both states last year. Since a portion of the Medicaid expansion population falls within the 100% - 138% FPL income zone, and since Pennsylvania has enrolled 500K in the program while Indiana has added over 290K to date, this could easily account for a substantial number of "missing" QHP enrollees. I took many factors into account when coming up with my state-level projections, but I completely forgot about this one. On the other hand, Montana also expanded Medicaid recently and is still kicking butt on the exchanges as well this year, so who knows?
Really, the single biggest disappointment continues to be Texas, of course. Aside from a general hostility towards the ACA in general in the Lonestar state, the biggest factor I can think of there is probably BCBSTX dropping their PPOs this year, which forced 367,000 people to get a different policy.
Again, California, DC, Kentucky, New York and Vermont can't really be counted at all because there's either no data available at all yet (or only very partial data in the case of CA).
Finally, there are 4 states which are running pretty much dead on target (within +/- 2%) of where I expected them to be at this point:
- Maine, West Virginia, Florida & Ohio
Overall, I've confirmed 9.74 million QHP selections nationally, but am pretty sure there's an additional 1.6 million already out there, likely as follows:
- California: Around 1.1 million renewals (in addition to the 197K new additions they've confirmed)
- New York: Perhaps 300K renewals + new
- Kentucky: Perhaps 90K renewals + new
- DC: Perhaps 17K renewals + new
- Vermont: Perhaps 25K
- Other state-based exchanges: Perhaps 70K collectively for missing days thru 01/02/16
(click the chart to load a full-sized version in a new browser window)
Advertisement
