Happy Wonky Holidays: 2016 vs. 2015 & 2014 Open Enrollment
I ran a version of this last year, and the response was positive enough that I've decided to do it again for the third year of open enrollment. Anyone who's into data visualization should find this pretty interesting.
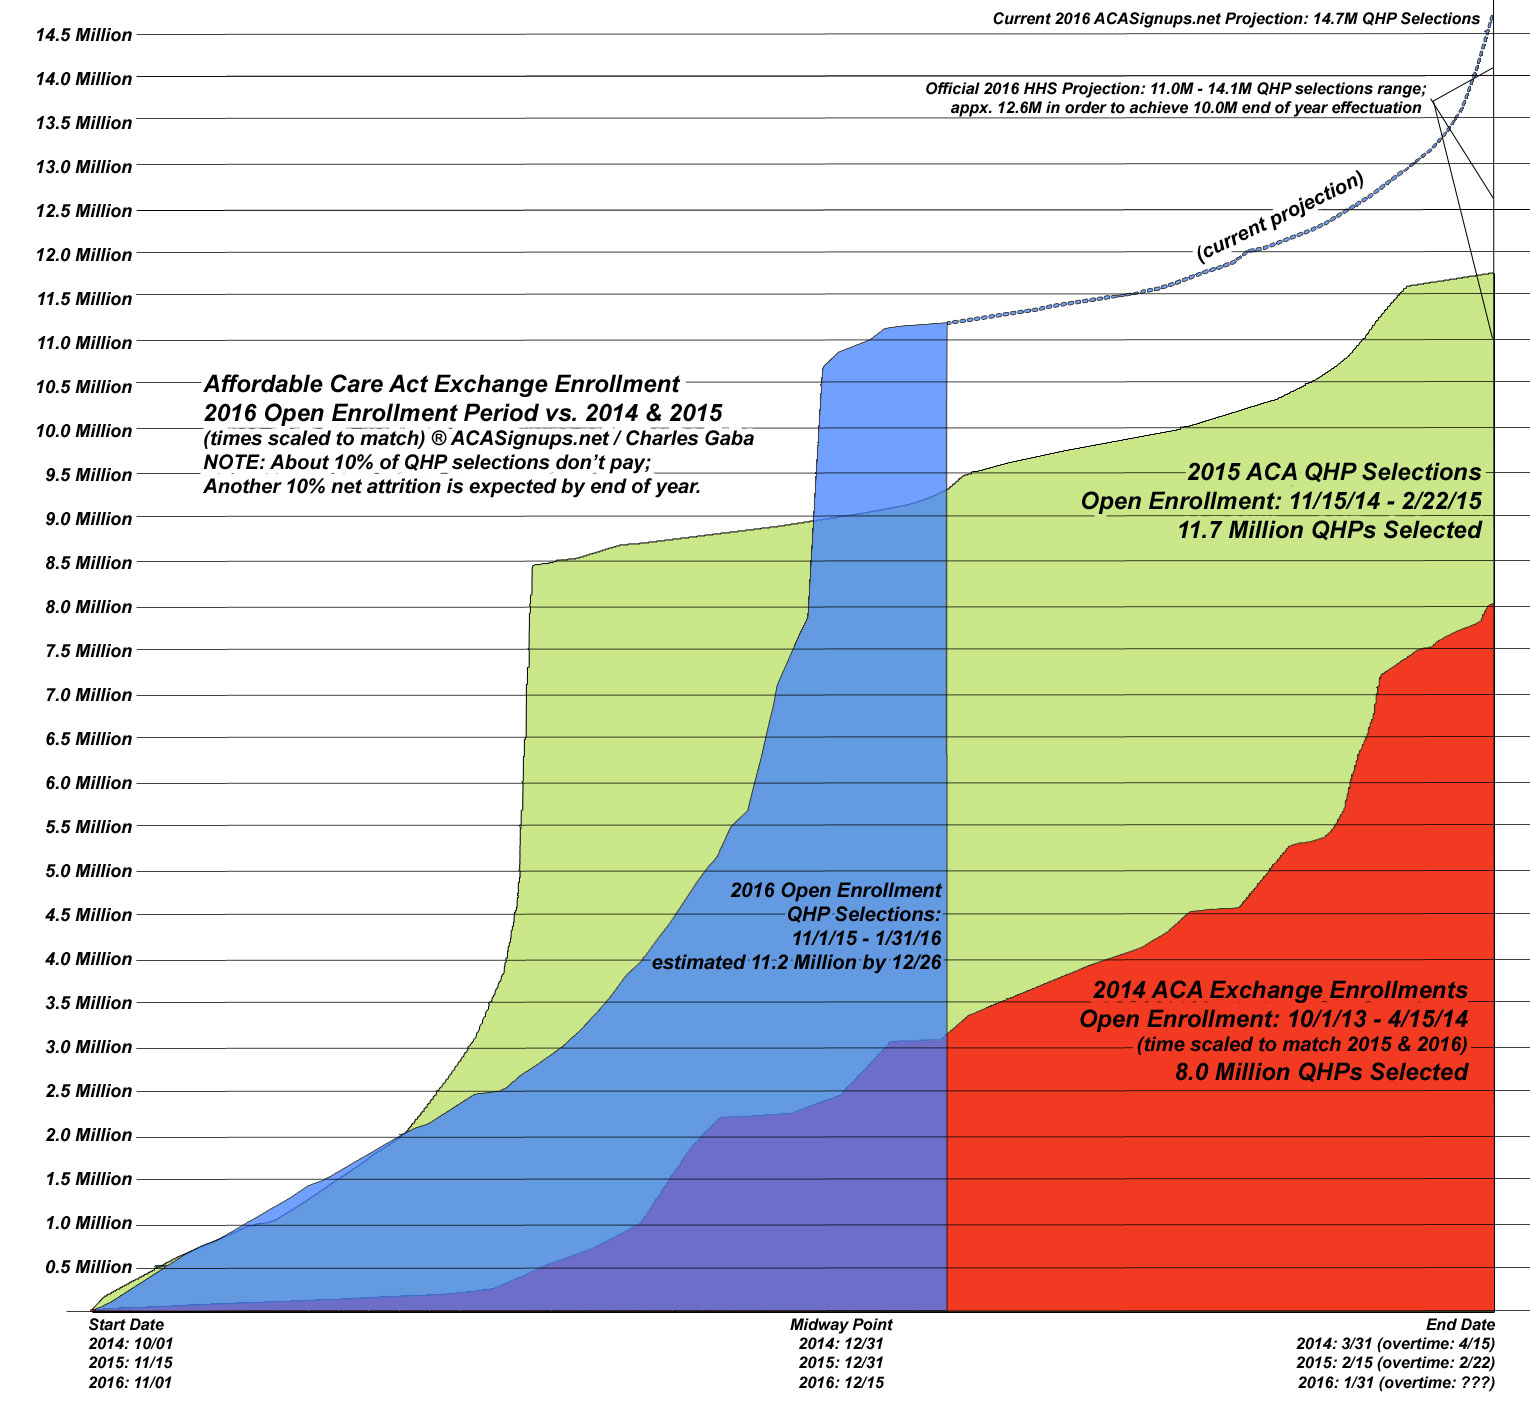
What I've done here is to take the 2014, 2015 and 2016 ACA Exchange Open Enrollment Period graphs and lay them on top of each other. It's important to keep in mind that these are for the open enrollment periods only.
Since 2014's period was 197 days (182 official, plus a 15 day "overtime" period), I've scaled it down to match 2015's 100 day period (93 days + 7 day overtime period) and 2016's 92 day period (I'm assuming there won't be any "overtime" this year, but could be wrong).
Also note that only 9.3 million QHP selections have been officially confirmed as of today; the additional 1.9 million are estimates on my part, including appx. 1.1 million renewals in California; 500K via New York, Kentucky, DC & Vermont; 150K remaining auto-renewals via HC.gov and another 150K assorted via missing days from various exchanges.
Assuming that I'm correct, this is what it should look like as of Saturday, 12/26. As you can see, yes, 2016 was, technically speaking, "falling behind" last year for about a month...but for a rather obvious reason: The enrollment period started 2 weeks earlier this year, while the mid-December deadline (when there's a massive surge in enrollments) remained the same.
Anyway, assuming the remaining 5 weeks play out roughly as I expect them to, the 2016 policy selection total should easily eclipse last year's 11.7 million. The big unknown is that final upwards curve the last week of January. At the moment I'm assuming a final spike similar to the mid-December deadline (around 1.8 million people), but if that doesn't happen then the final total could easily be several hundred thousand fewer.
Happy Holidays to you all!
How to support my healthcare wonkery:
1. Donate via ActBlue or PayPal
2. Subscribe via Substack.
3. Subscribe via Patreon.


