

By the Numbers: State-By-State Comparisons (#OE2 Final)
Tue, 03/10/2015 - 5:41pm
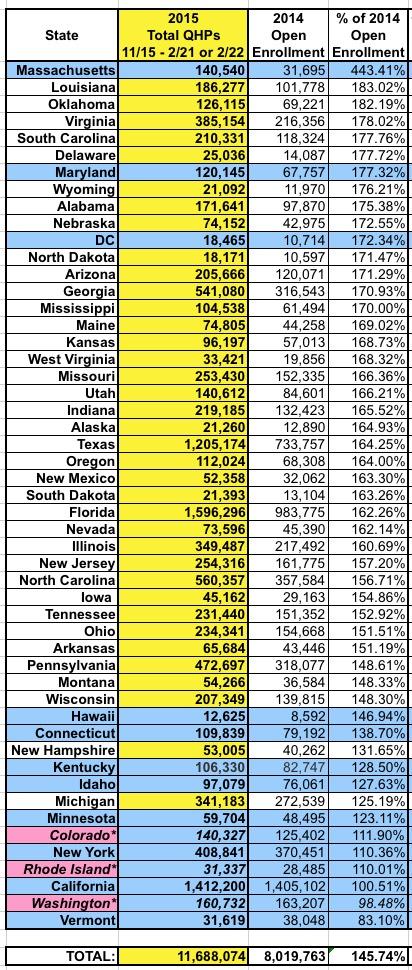
There's not a huge amount of position shifting here (other than Hawaii), but with today's final official ASPE enrollment report for 2015 Open Enrollment having been released, it seems appropriate to do this one more time:
|
The biggest change here is that Hawaii is no longer near the top of the list due to the confusing report from the HI exchange a few weeks back. Otherwise, aside from Massachusetts (special case) and Maryland (these are the only 2 exchanges to overhaul their prior tech platform with new ones while remaining self-contained), DC is the only "state" exchange in the top third. The other state exchanges are all down at the bottom. Why? Two reasons: First, 3 of the states (CO, RI & WA) are only listing paid enrollments (or at least are purging past-due unpaid selections before submitting their data to HHS). Secondly, because HC.gov has simply caught up this year after being smoked the last time around. |
|
As noted earlier, Alaska aside (tiny numbers to begin with), the real shocker here is Florida, which crushed everyone else in sheer enrollment number, even California (which barely managed to outpace 2014). For all the grief that California has received over barely surpassing their 2014 total, the New York is the state which performed the worst relative to their official expectations. I thought NY was crazy to think they'd nearly double enrollments this year (720K vs. last year's 370K), but that's what they said (CNY's Dan Goldberg even double-checked at the time). Again, 3 states (Rhode Island, Washington State and Colorado) actually did a bit better than the numbers indicate because they already "pre-purged" some or all of their unpaid enrollments; RI & CO would likely be at around 90% and 77% of their targets respectively if they included all QHP selections, and WA would likely be at around 85% if they did so. |
|
In the end, I was off by about 6.5%, or roughly 800,000 people. The main reason for this was California and New York; these two states alone made up 690,000 of the difference (although other states cancelled some of that out). In addition, again, CO, RI & WA only report paid or "semi-paid" enrollments, cutting into the "plan selected" numbers a bit more. |
|
Finally we come to what's probably the most important table: Out of the entire pool of potential ACA private exchange enrollees, how many did each state manage to rustle up? Vermont may have done the worst year over year, but they didn't have that many additional people to enroll in the first place; they lead the pack with over 70% of those who were even eligible to enroll having done so. Next up is Florida which, again has done an amazing job this year, enrolling nearly 64% of their total pool. An amazing job for a state with a completely Republican-controlled House, Senate and Governor's office. At the opposite end of the spectrum are Iowa and South Dakota, which simply don't seem to like the ACA at all (shocker)...but also Minnesota and Hawaii, which very much do. Overall, roughly 42% of the 28 million people who are eligible to enroll via one of the ACA exchanges have done so, although only around 37% (10.3 million) will likely pay at least their first monthly premium. In addition, another 8 million or so have likely enrolled in ACA-compliant policies directly (ie, off-exchange). That leaves perhaps 8 million more who could enroll via the exchanges but haven't done so as of yet. A few million of these are currently enrolled in non-compliant private policies ("grandfathered" or "transitional" policies allowed for under either the ACA or last year's "You Can Keep It" extension waivers). The other 5 million or so are presumably uninsured people who can afford an exchange policy but haven't chosen to enroll in one yet; some of these (perhaps up to a million?) will presumably enroll during the tax season Special Enrollment Period in March/April. The most noteworthy thing I see in this table, actually, is that unlike the other 3, which have the same pattern (a couple of state exchanges at the top but the rest of them bunched up at the bottom), this one features a remarkably even spread between Healthcare.Gov states and State-Based exchanges; there's no connection between how effective a particular state was in enrolling a certain percentage of their eligible target market and whether they were on HC.gov or not. What this says to me is that while the state exchanges held the upper hand in 2014 (since many of them had a 2-month head start on HC.gov), this year HC.gov found its stride and caught up. In fact, if you add up the total eligible populations of the state-based exchanges (7,591,000), they make up 27% of the total...only slightly higher than the 24% of those who actually enrolled this year. Of course, those numbers are slightly skewed by the fact that Idaho moved off of HC.gov this year while OR & NV moved onto it, but the point is still valid. In other words, the exchanges, overall, have pretty much reached parity in Year Two. Assuming the SCOTUS doesn't botch everything up with King v. Burwell this summer, I'd expect every exchange, federal or state, to pretty much pull its weight. |
 2015 vs. 2014:
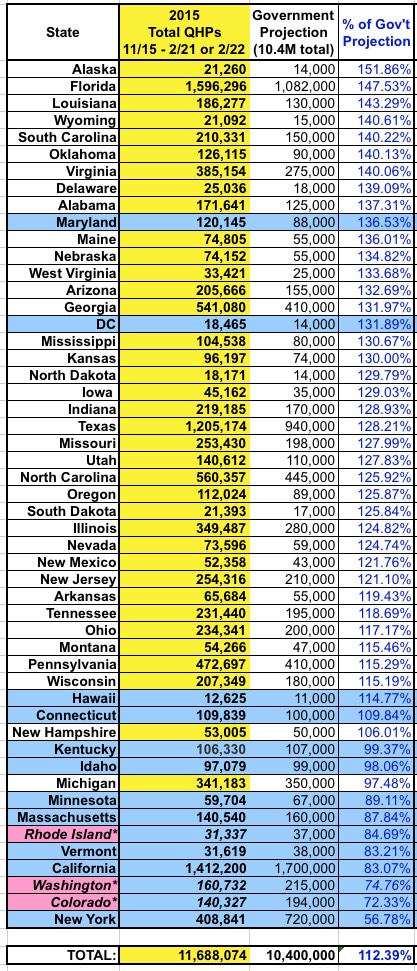 2015 vs. HHS Dept. / State Gov't / State Exchange Projections:
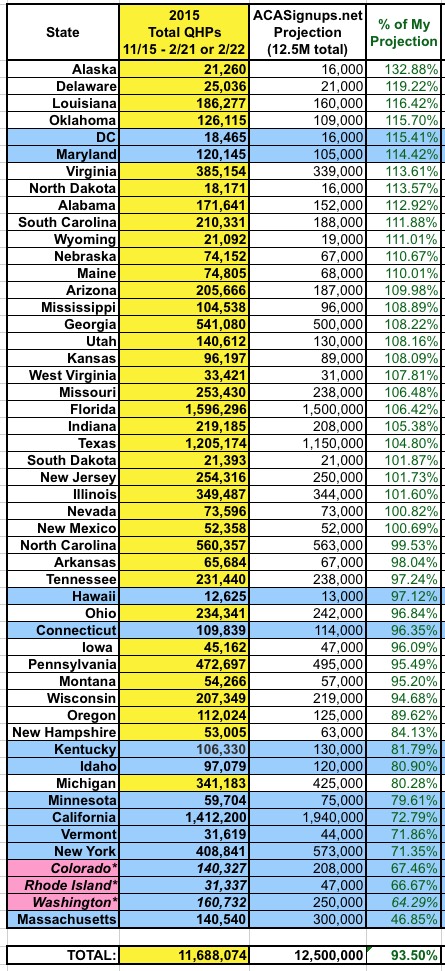 2015 vs. MY (original) State Projections:
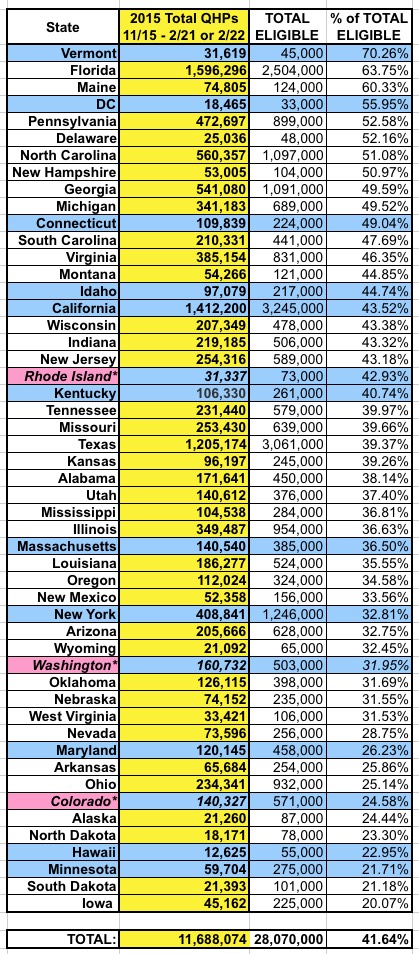 2015 vs. Total Potentially Eligible
Advertisement
